
Fig. 3.
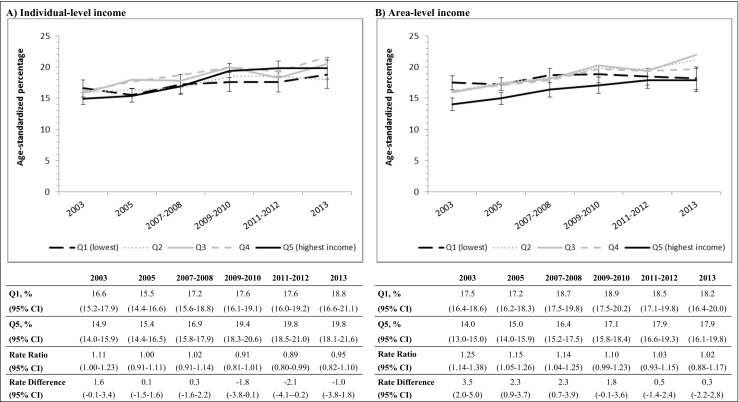
Trends in obesity prevalence among men between 2003 and 2013, by individual-level and area-level income quintiles, and corresponding estimates of relative inequality (rate ratio) and absolute inequality (rate difference). Note: all estimates are age standardized