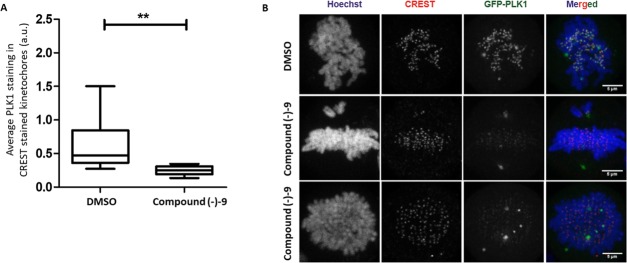
Figure 4.
Treatment with compound (−)–9 causes mislocalization of PLK1 from kinetochores in mitotic cells. (A) Cells expressing GFP-PLK1 were treated with compound (−)–9 or DMSO for 9.5 h after double thymidine release. The cells were fixed, stained for DNA (Hoechst) and kinetochores (CREST antisera), and analyzed by immunofluorescence microscopy. Prometaphase mitotic cells were identified based on DNA morphology, and 1 μm confocal Z-stacks were taken for each cell. Quantification of GFP-PLK1 intensity on CREST-stained kinetochores was carried out using ImageJ. The data is represented as the Whisker maximum to minimum plot with a horizontal bar indicating mean GFP-PLK1 intensity on kinetochores. Statistical analysis was done using a nonparametric, Mann–Whitney two-tailed test with a 95% confidence interval, **p = 0.0037. 8 cells were analyzed for DMSO and 7 for compound (−)–9. (B) Representative maximal-intensity projection images of cells showing CREST-stained kinetochores (red), GFP-PLK1 (green), and DNA (blue) used for quantification of GFP-PLK1 intensity in Figure 4A. The scale bar is 5 μm.

