
Figure 2.
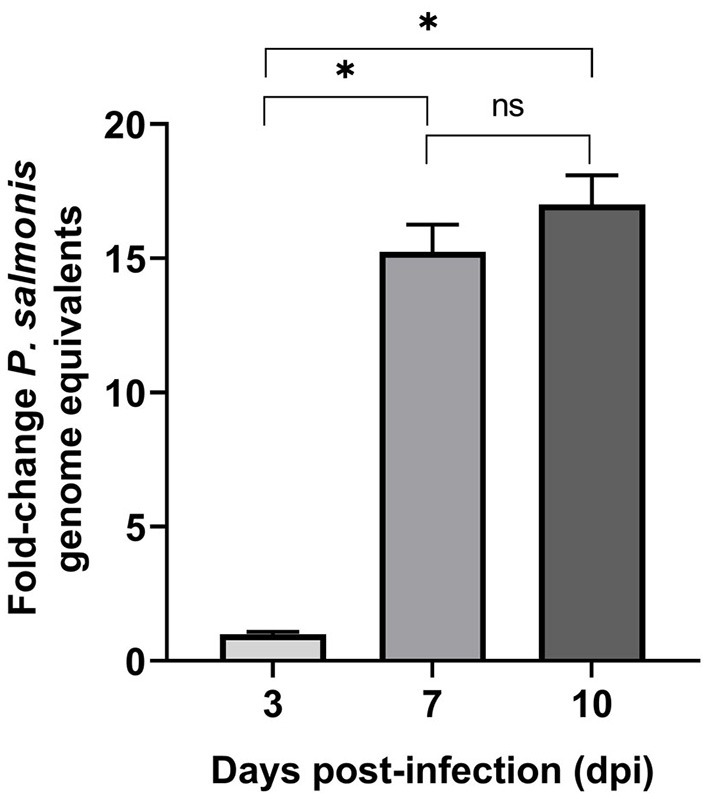
P. salmonis genome levels during infection of SHK-1 cells. For each sample, an equal amount of total gDNA was analyzed by quantitative qPCR with primers designed for the glyA gene. Results represent the mean of three biological samples with three technical replicates of each sample. Data are presented as fold changes in genome numbers relative to 3 dpi. Standard error bars represent the combined standard error of the mean per time point. Asterisks above the bars indicate significant differences (p < 0.05), ns, no significant differences. Data were analyzed with GraphPad Prism V8.0.1 using an unpaired t-test with Welch‘s correction.