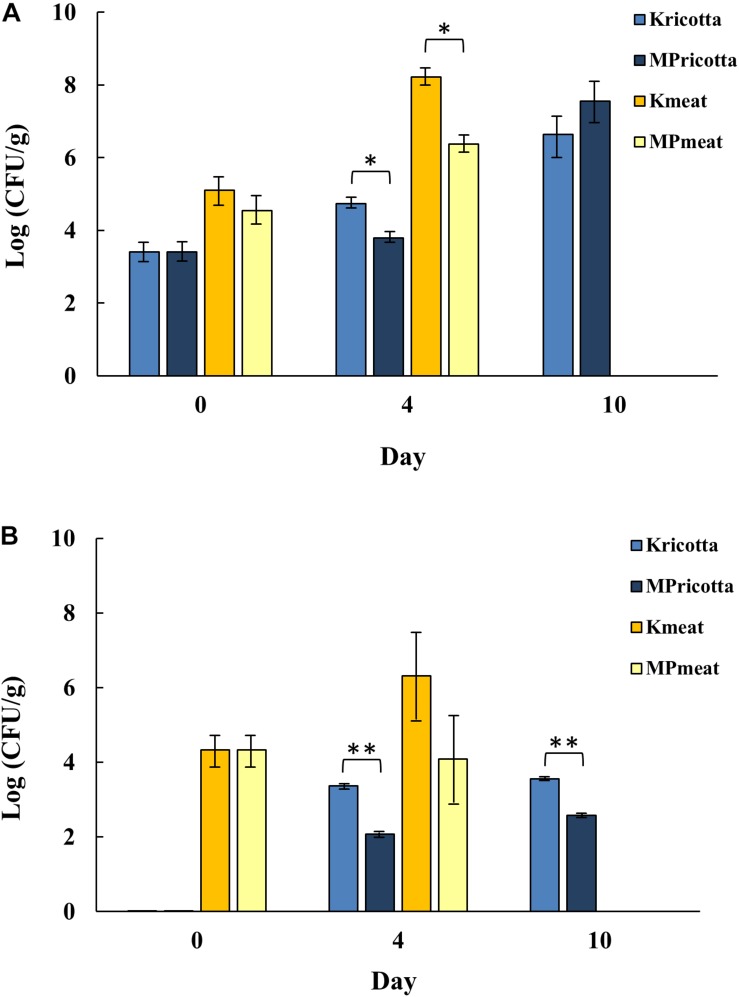
FIGURE 3.
Evolution of (A) aerobic plate count (APC) and (B) yeast counts of ricotta cheese and meat, treated with MTP1-PETs (MP) during different days. Not-functionalized PETs were used as control (K). Data are presented as means ± s.d. of five different samples analyzed in triplicate. ∗, Significant difference (p < 0.05) between the treated and the control samples; ∗∗, Significant difference (p < 0.01) between the treated and the control samples.

