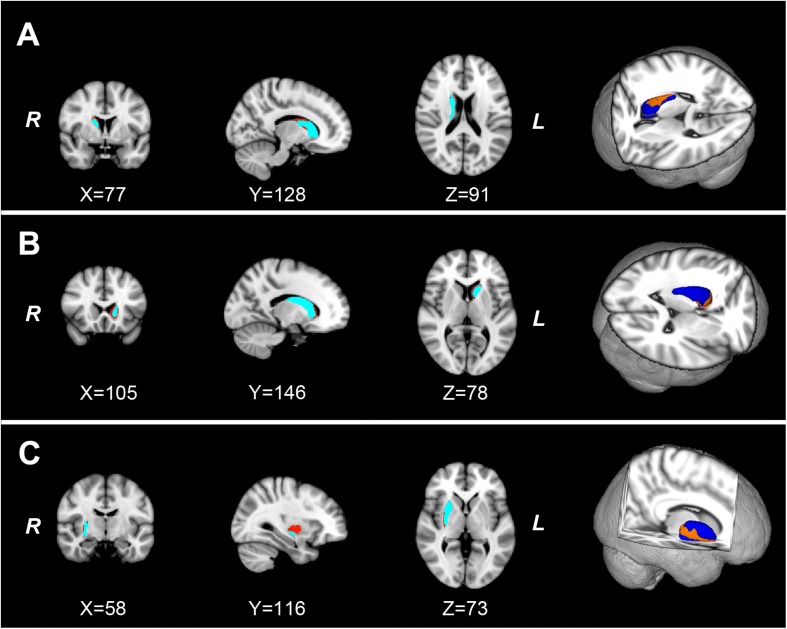
FIGURE 1.
The localized shape differences between HC and PD groups using vertex-wise surface analyses of each subcortical nucleus. The regions in orange indicate the different regions of the characteristic subcortical nuclei between PD and HC groups. (A) Group differences of the right caudate are located in the body and tail subdivisions. (B) Group differences of the left caudate are located in the head subdivision. (C) The group differences of the right putamen are located in the ventrolateral subdivision of putamen. HC, healthy control; PD, Parkinson’s disease.

