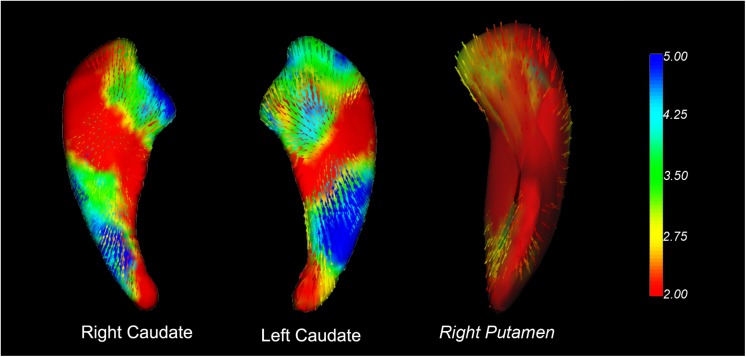
FIGURE 2.
Vector graphs of the bilateral caudate and right putamen according to the traditional surface-based vertex analysis displayed by 3D mesh. The color bar indicates the statistical values; an increase from red to blue indicates a lower to higher statistical significance. The small arrows shown on the surface indicate the direction of change. The inward arrows indicate the direction of difference, suggesting that these subcortical nuclei are smaller/thinner here than in the healthy control groups.

