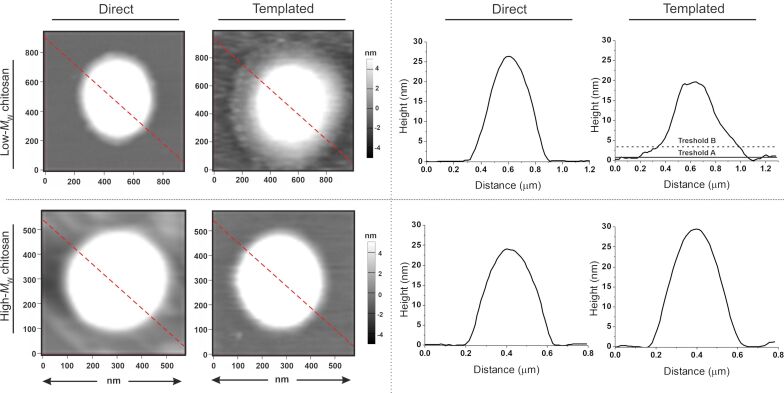
Figure 2.
Tapping-mode AFM height images of chitosan/HA dried on mica (left) and height profiles corresponding to the red dashed lines in the images (right). For the templated Chit35/HA nanoparticles two thresholds were used to calculate separately the volume distributions of the nanoparticle corona and core. Please note that the HA corona is even more visible in amplitude images, see Supporting Information File 1, Figure S2.

