Fig. 5.
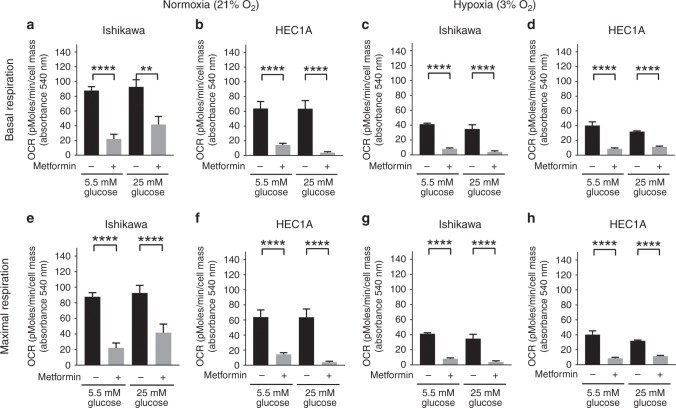
Hypoxia and hyperglycaemia reduce the effect of metformin on mitochondrial oxidative phosphorylation. Ishikawa and HEC1A cells were exposed to different concentrations of glucose (5.5 mM vs 25 mM) and oxygen (21% vs 3%) with or without 2 mM metformin for 72 h. Grey and black bars represented mean ± SEM with and without metformin treatment, respectively. In normoxia (21% O2), treatment with metformin impaired basal (a, b) and maximal respiration (e, f) in low or high glucose. In hypoxia (3% O2), a reduction in basal (c, d) and maximal (g, h) respiration was observed in both glucose concentrations (n = 3 biological replicates)

