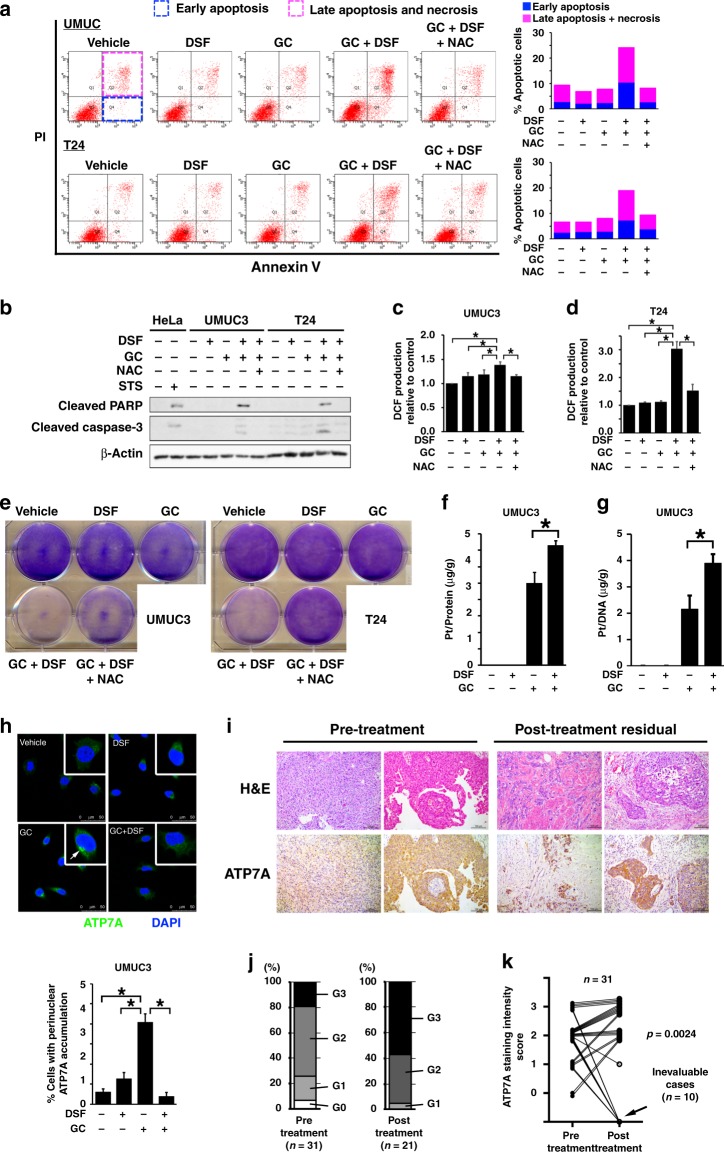
Fig. 2.
Co-administration of DSF increases DNA–Pt adducts and ROS production, and enhanced apoptosis with perinuclear localisation of cisplatin efflux transporter ATP7A precluded. a Apoptosis was evaluated with Annexin V-FITC/propidium iodide and flow cytometry in cells treated as indicated for 36 h. The effects of the antioxidant (NAC) were also evaluated. b Western blot analysis for cleaved PARP and cleaved caspase 3 levels in UMUC3 and T24 cells treated as indicated for 36 h. HeLa cells were treated with 1 μM of staurosporine (STS), which is known to induce apoptosis. c, d ROS production was assessed by DCF. UMUC3 (c) and T24 (d) cells were treated as indicated for 18 h. The effect of NAC was also evaluated. *p < 0.05. e Colony-formation assays were performed in UMUC3 and T24 cells treated as indicated with addition of NAC (1 mM) for 72 h. Cells were stained with crystal violet. f Whole-cell Pt accumulation. UMUC3 cells were treated with 10 μM DSF and GC for 1 h, and then whole-cell lysates were subject to ICP-MS assay to quantify intracellular Pt accumulation (normalised by cellular protein amount). *p < 0.05. g Pt–DNA-adduct accumulation assessed by ICP-MS. UMUC3 cells were treated with 10 μM DSF and GC for 1 h, and cellular DNA was extracted and subjected to ICP-MS assay (normalised by DNA amount). *p < 0.05. h Top: confocal microscopy images showing the effect of GC and DSF on the intracellular localisation of ATP7A (green fluorescence). UMUC3 cells were treated as indicated for 1 h. Nuclei were stained with DAPI (blue). Bars indicate 50 μm. Bottom: quantitative analysis of the percentage of cells with perinuclear accumulation of ATP7A. Seven randomly selected microscopic fields were quantitatively analysed by Image J. **p < 0.01. i Representative microphotographs of pre-treatment and post-neoadjuvant chemotherapy (post-chemotherapy) bladder urothelial carcinoma by using H&E and ATP7A staining. Bars indicate 100 μm. j Distribution of ATP7A staining intensity score for pre-treatment (n = 31) and post-chemotherapy (n = 21) tumours. Post-chemotherapy tumours could not be evaluated in ten cases with no or very little viable tumour lesions (pT0 in 4, pTis in 4, pT1 in 1 and pT3b in 1). k Statistically significant changes in ATP7A staining intensity score between pre-treatment and post-chemotherapy tumours in the 31 patients (Wilcoxon’s ranked-sign test was applied for 21 patients with post-chemotherapy residual tumour)

