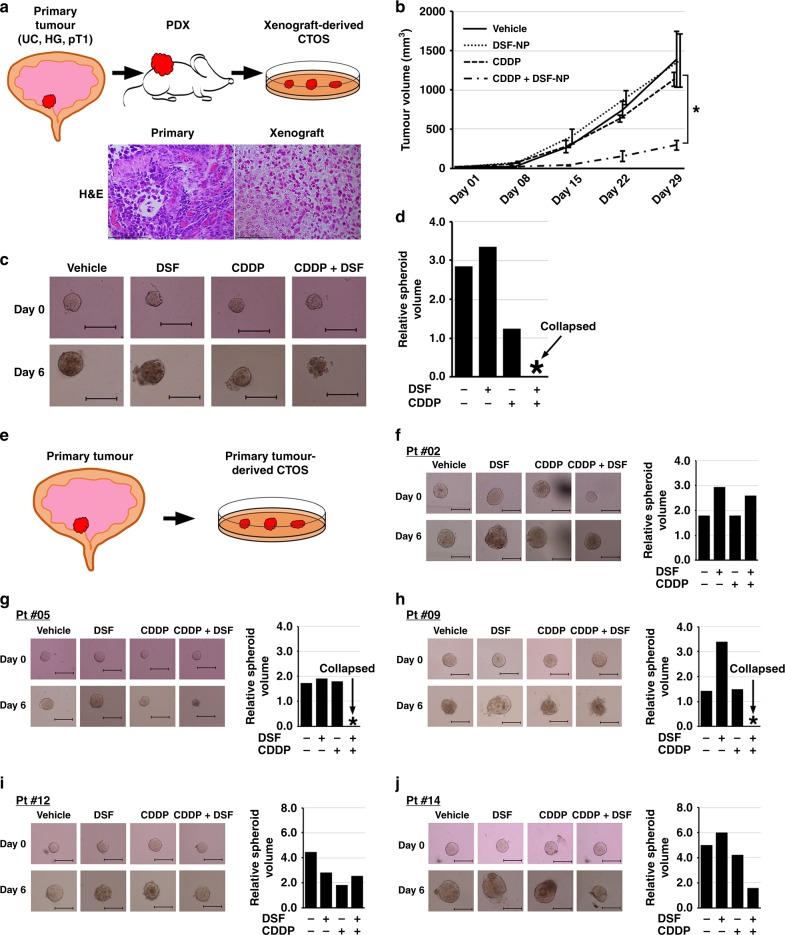
Fig. 4.
DSF enhances the inhibitory effect of CDDP in preclinical models. a Schematic diagram of PDX and xenograft-derived CTOS model. Subcutaneous PDX lines were established from transurethrally resected specimens of primary tumour (high-grade urothelial carcinoma, pT1; HG, UC and pT1), and PDX tumours were subject to CTOS culture. H&E microphotographs show histological similarity between primary and xenograft tumours. Bars represent 100 μm. b Tumour growth rate in the subcutaneous PDX models. Two weeks after implantation of tumours, mice were randomised into four groups (n = 3) and treated with vehicle, DSF-NP (3 mg/body i.v.), CDDP (4 mg/kg i.v.) or CDDP in combination with DSF-NP. *p < 0.05 (CDDP + DSF-NP vs. single treatment). c Representative images of xenograft-derived CTOS in pre- (day 0) and post-treatment (day 6) settings. Note that CTOS treated with CDDP and DSF collapsed, while others grew and maintained a spheroid shape. d Relative volumes of spheroids on day 6 to those on day 0. e Schematic diagram of the direct primary tumour-derived CTOS model. Transurethrally resected specimens of primary tumours were directly subject to CTOS culture. f–k Representative images of CTOS derived from primary tumours from five patients pre- (day 0) and post treatment (day 6) (left), and relative volumes of spheroids on day 6 to those on day 0 (right)

