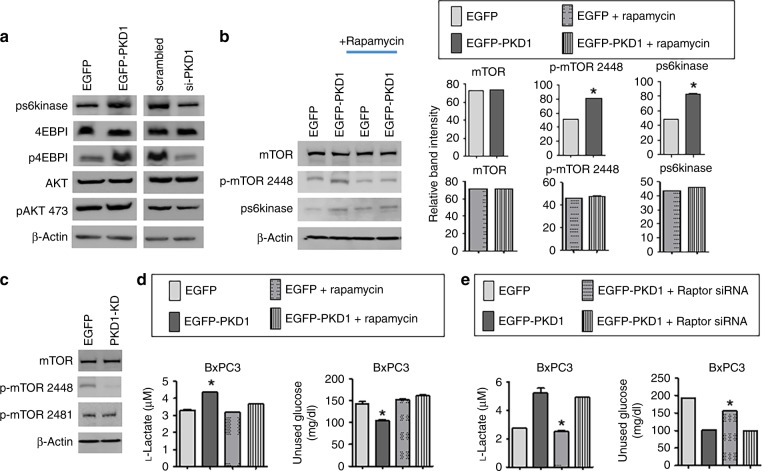
Fig. 5.
PKD1 increases glucose metabolism via mTORC1 activation. a Western blot to analyse the expression level of important proteins associated with mTORC1 and mTORC2 complex following overexpression and silencing of PKD1 in HPAF-II and Panc-1 cells, respectively. b Immunoblotting depicting the expression of p-mTOR-S2448 and ps6kinase, the major downstream effectors of mTORC1 in the presence and absence of rapamycin. The right panel represents the densitometry analysis of band intensity. c Immunoblotting showing the expression of phosphorylated p-mTOR 2448 and p-mTOR-S2481, the major phosphorylating domain of mTORC1 and C2, respectively, following transfection with PKD1 kinase dead domain. d Lactate and glucose assay in PKD1-expressing, BxPC3 cells in the presence and absence of rapamycin and e Raptor and Rictor siRNA. P-values are denoted as *P < 0.05. The blots were re-probed multiple times with β-actin being used as a protein-loading control

