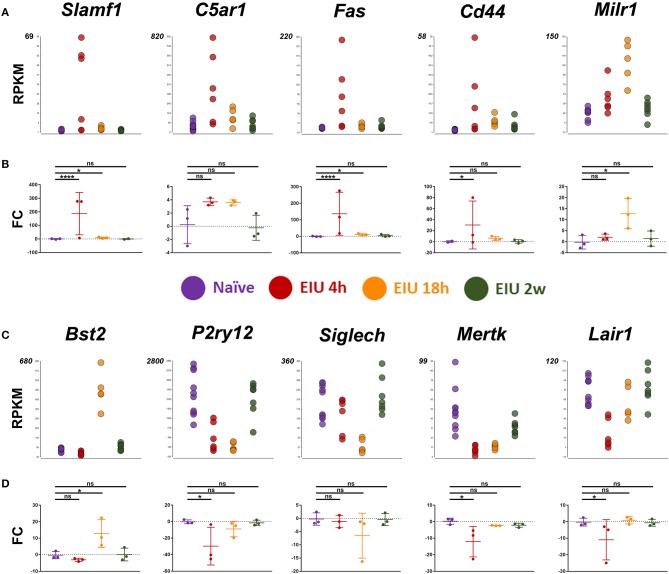
Figure 5.
Transcript changes in selected markers, using cDNA generated from 600 sorted microglia, over a time-course of EIU. (A,C) RPKM values are shown for the 10 selected markers (B,D) in-line vertically with matching qPCR validation. EIU, endotoxin-induced uveitis; FC, Fold-change; RPKM, reads per kilobase of transcript per million mapped reads. *p ≤ 0.05, ****p ≤ 0.0001, ns, not significant.

