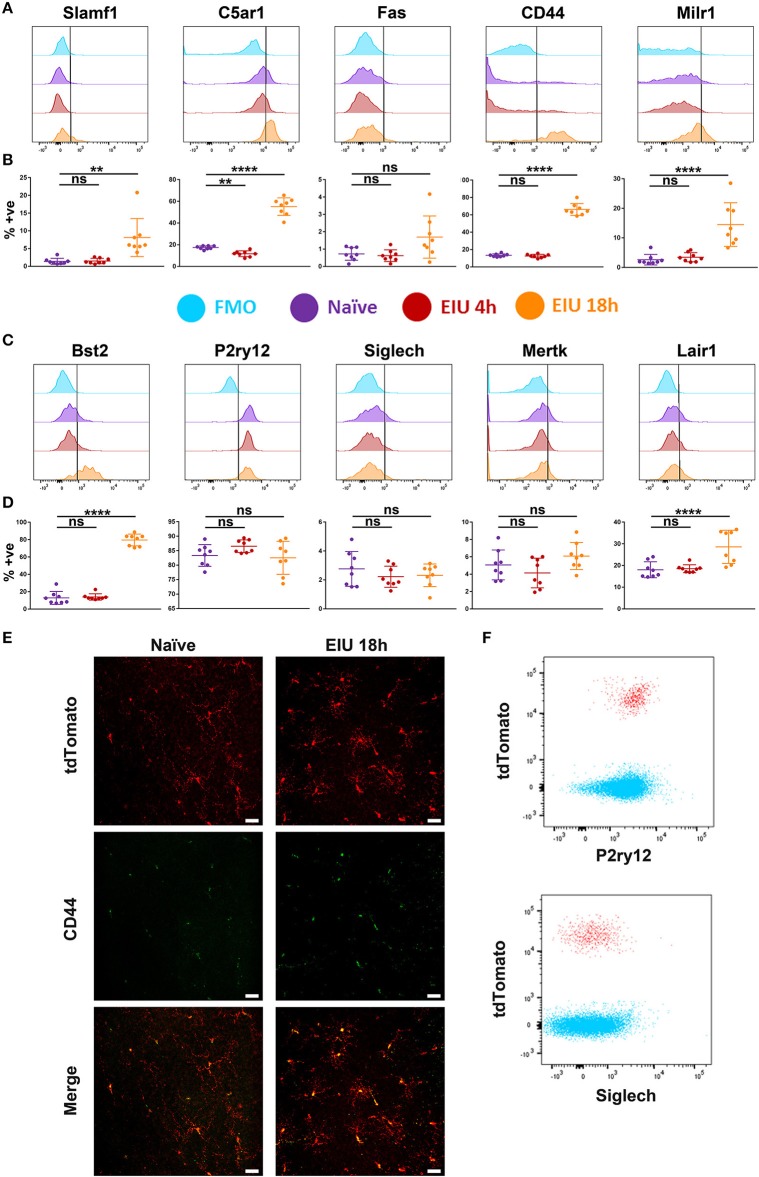
Figure 6.
Changes in protein expression of selected markers in microglia over a time-course of EIU. (A,C) A representative flow cytometric histogram is shown for the 10 selected markers (B,D) in-line vertically with matching scatterplots of the aggregate flow cytometry data summarising the percentage of microglia positive for each marker at each timepoint. Gates were drawn with the assistance of fluorescence-minus-one (FMO) controls (light blue). (E) Confocal microscopy also confirms the upregulation of CD44 in microglia during EIU. (F) Flow cytometric analysis demonstrates P2RY12 and SIGLECH expression on CD45+ tdTomato− non-microglial immune cells (blue) and CD45+ tdTomato+ microglia (red) at 18 h EIU. % +ve, percentage positive; EIU, endotoxin-induced uveitis. **p ≤ 0.01, ****p ≤ 0.0001, ns, not significant. Scale bars = 30 μm.

