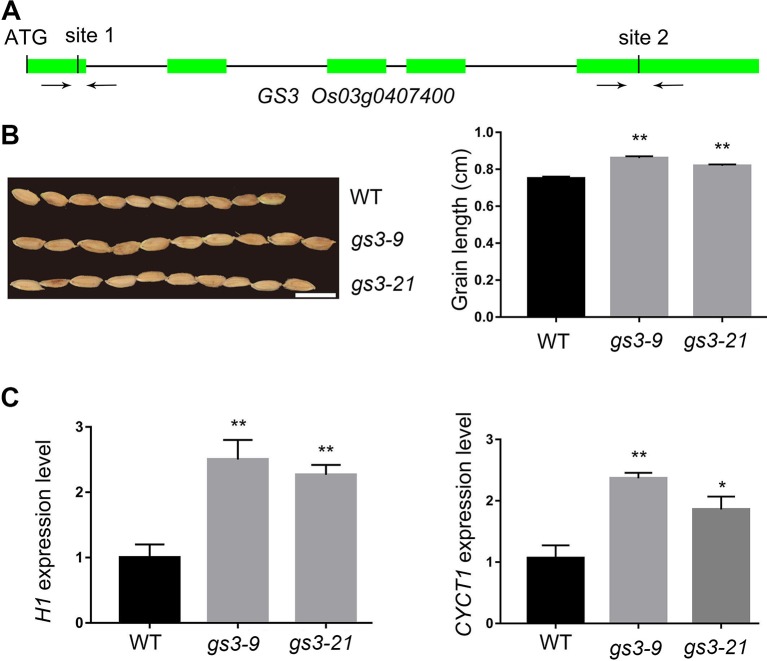
Figure 3.
CRISPR/Cas9-induced gs3 mutants and the expression level of cell cycle-related genes. (A) Schematic representation of the GS3 genomic region. The two target sites of GS3 and PCR primers were marked in first and fifth exons. (B) The grain phenotype of gs3–9, gs3–21 and WT, and statistics for the average grain length. Bar = 1 cm. (C) The expression level of marker gene OsH1 and OsCYCT1 in WT, gs3–9 and gs3–21. Data are means ± SD from three biological replicates. Student’s t test, **P < 0.001, *0.001 < P < 0.05.

