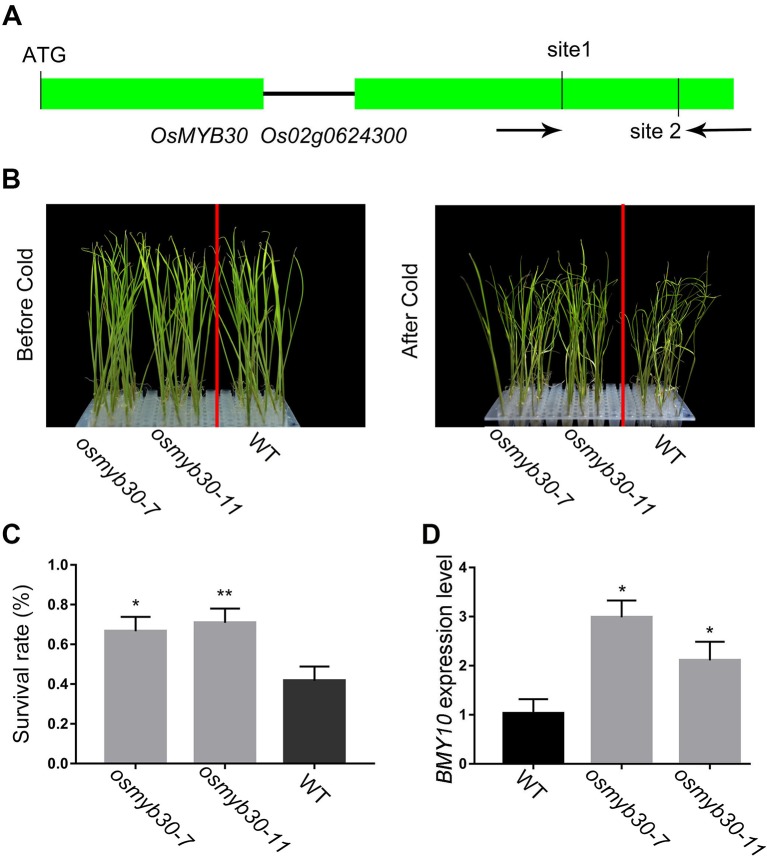
Figure 4.
The phenotype analysis of osmyb30 mutants and the expression level of downstream BMY10 gene. (A) Schematic representation of the OsMYB30 genomic region. The two target sites of OsMYB30 and PCR primers were marked in second exon. (B) The seedlings of osmyb30-7, osmyb30-11 and WT after being treated in 4°C chamber. (C) The survival rate of osmyb30 mutants after 4°C treatment. (D) The expression level of marker gene OsBMY10 in WT, osmyb30-7 and osmyb30-11. Data are means ± SD from three biological replicates. Student’s t test, **P < 0.001, *0.001 < P < 0.05.

