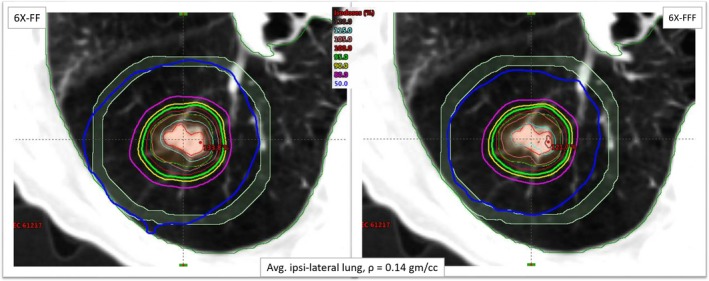
Figure 2.

Comparison of dose distributions in the axial view for patient #6 (lowest average ipsilateral lung density of 0.14 gm/cc) with both 6X‐FFF (right panel) and 6X‐FF (left panel) beams. The red contour represents the ITV, orange represents the PTV (10.7 cc), green represents the 95% isodose line that encompasses the PTV and the blue line represents the 50% isodose‐spillage (much tighter with 6X‐FFF beam). The tumor was located in the middle of the right lung. The viewing plane intersection shows the isocenter location. The light blue ring was generated to calculate D2cm around the target volume. ITV, Internal target volume; PTV, planning target volume.
