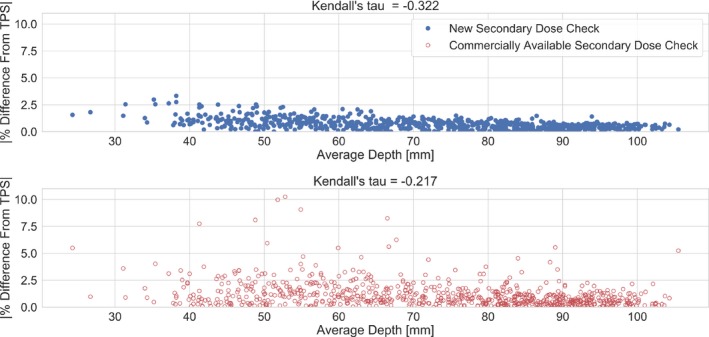
Figure 4.

The results of the Kendall’s tau correlation evaluation. The absolute percent difference from the TPS for the new software shows a moderate correlation with average calculation depth (tau = −0.322). The absolute percent difference from the TPS for the commercial software shows a weak correlation with average calculation depth (tau = −0.217). TPS, treatment planning system.
