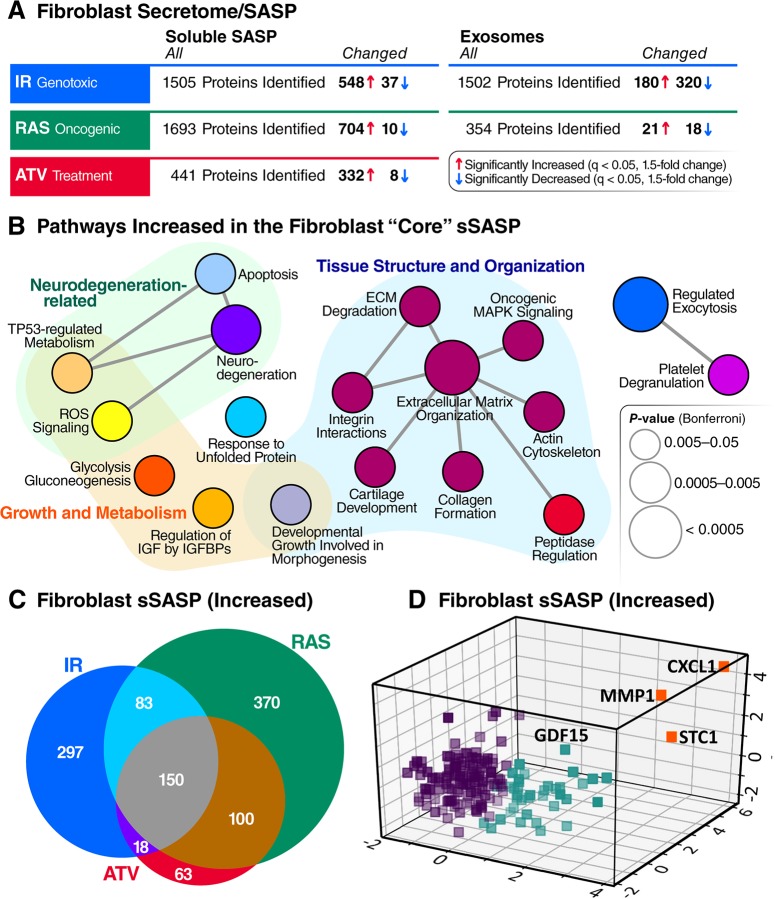
Fig 2. Core sSASP proteins, networks and pathways.
(A) Summary of proteins with significantly altered (q-value <0.05 and >1.5-fold change) secretion by senescent compared with quiescent cells following genotoxic, oncogenic, or ATV treatment stress in senescent human lung fibroblasts. (B) ClueGO [33] pathway enrichment and network analyses of overlapping sSASPs resulting from each senescence inducer. Pathways of the same color have ≥50% similarity. Connecting lines represent Kappa connectivity scores >40%. (C) Venn diagram of proteins showing significantly increased secretion in senescent versus non-senescent fibroblasts following induction of senescence by IR, RAS, or ATV. (D) Unsupervised K-means clustering of proteins significantly increased in the sSASPs of all inducers based on the magnitude of the protein changes (log2-fold change) in senescent versus control groups and partitioned into three clusters. ATV, atazanavir treatment; CXCL1, chemokine C-X-C motif ligand 1; ECM, extracellular matrix; GDF15, growth/differentiation factor 15; IGF, insulin-like growth factor; IGFBP, IGF binding protein; IR, X-irradiation; MMP1, matrix metalloproteinase-1; RAS, RAS oncogene overexpression; ROS, reactive oxygen species; sSASP, soluble senescence-associated secretory phenotype; STC1, stanniocalcin 1; TP53, tumor protein p53.

