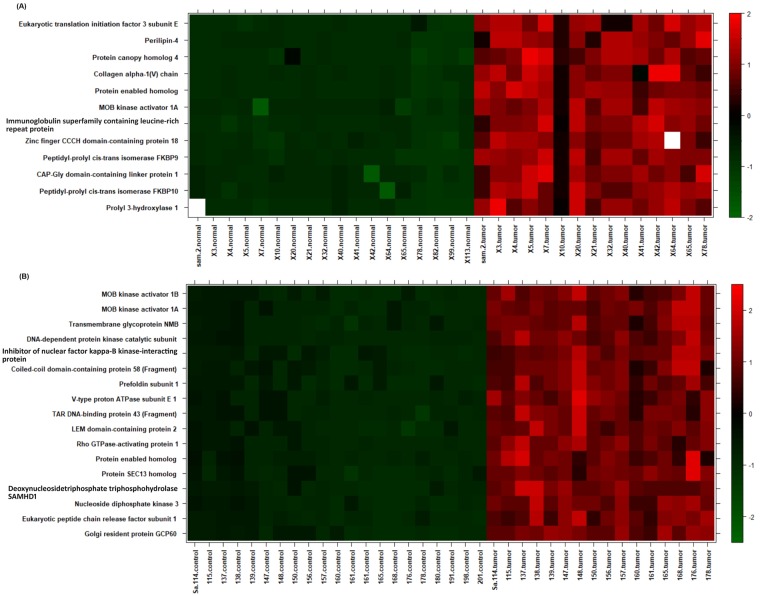
Fig 3. Heat map analysis of the detected proteins in stage 2 and 3 of the tumor and normal breast tissues.
Heatmap of significantly different proteins between tumor and normal breast tissues. Samples on x-axis were ordered by tumor or normal group. The color code denotes z-scaled values of proteins signal intensities.

