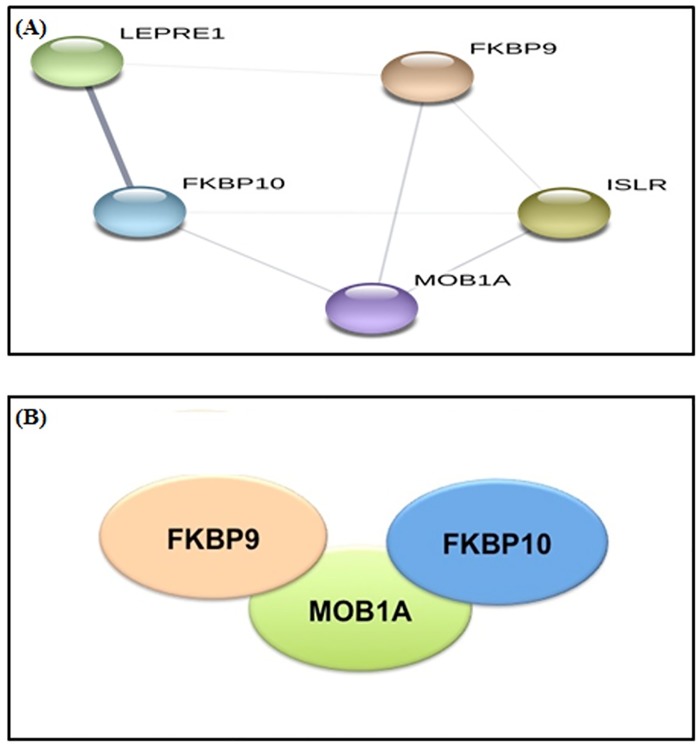
Fig 5.
(A) Functional network of proteins in stage 2 breast cancer samples, (confidence level = 0.150). (B) Molecular pathway of proteins as predicted by STRING. Schematic representation of potential protein-protein interactions. This is predicted directly by DAVID, each ellipse represents a protein, and the representation suggests the interaction pathway. In this case, MOB1A interacts independently with FKBP9 and FKBP10.

