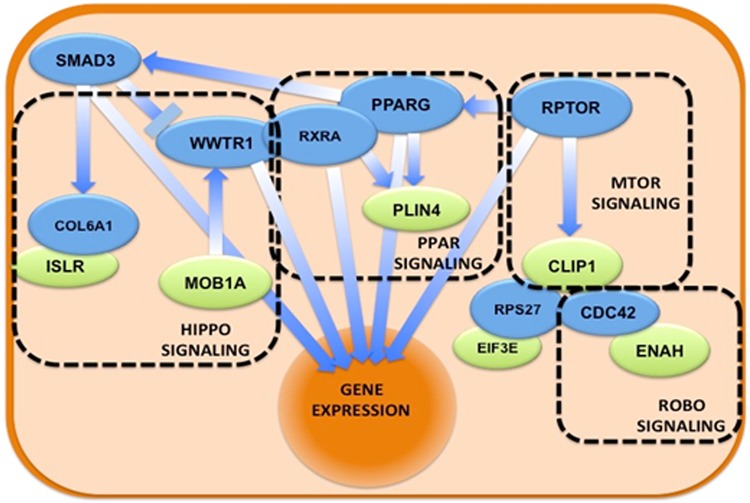
Fig 6. The biological network obtained using linker nodes for stage 2 breast cancer samples.
Schematic representation of the molecular pathways in which the proteins of the set participate. Green ellipses represent proteins, while blue ellipses represent proteins that link all the input proteins. Overlapping proteins suggest physical interactions, while arrows indicate direct regulation. In dashed rectangles the different biological pathways that Reactome-FI detects as overrepresented in the full. The nucleus is represented as a wide orange ellipse because several pathways end with the effect on gene expression.

