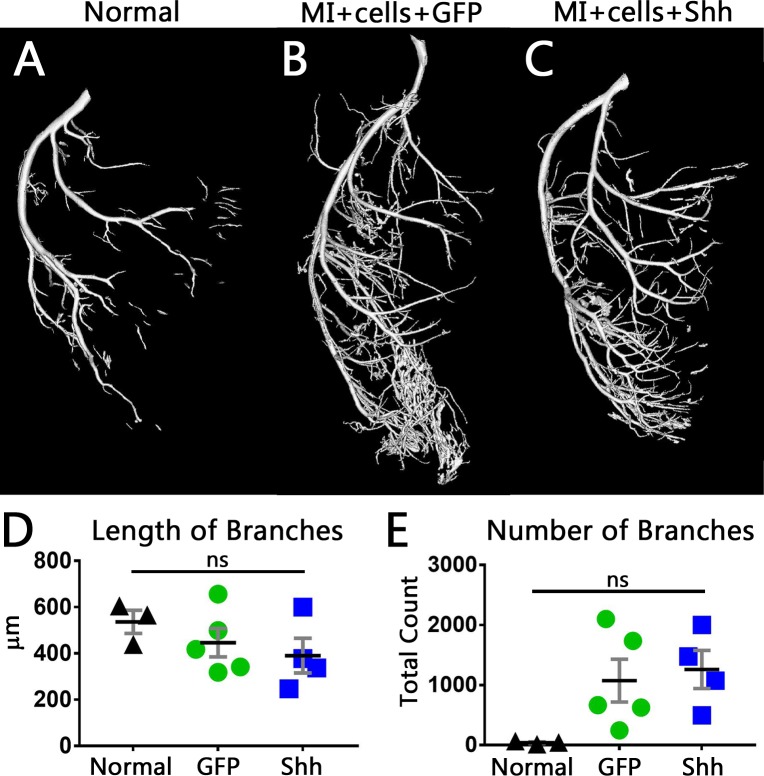
Fig 7. Measurements of branches within the LCA tree shows a trend toward shorter branches and more branches in the Shh treated hearts.
(A-C) 3D reconstructions of the LCA within normal hearts (A) or hearts that were infarcted, and injected with hSC-CMS after treatment with either GFP virus (B) or Shh virus (C). (D,E) Quantification of the LCA branching structure. Shh treated hearts trend toward shorter branches (D) and more branches (E). Black line is mean, error bars are SEM.

