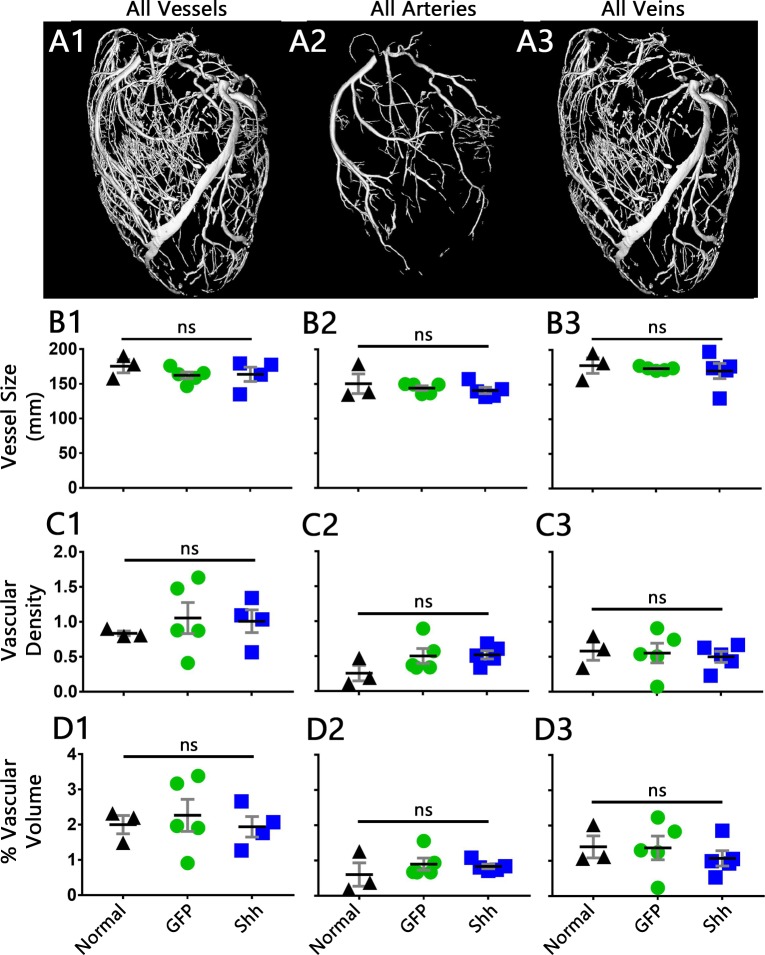
Fig 8. Analysis of vascular measurements shows no change between Shh and GFP treated hearts.
(A1–3) 3D reconstructions of the vasculature within a normal heart, segmented to show the vascular subset analyzed within each column: all vessels (column 1), all arteries (column 2), all veins (column 3). Datasets for LCA, RCA, and LCV are in S3 Fig. (B-D) Quantification of vascular measurements, as specified. Vessel size is equivalent circular diameter (2D vessel cross sections, B), vascular density is number of vessels per square mm (2D cross sections, C), and percent vascular volume is the 3D volume of vessels compared to the 3D volume of heart tissue (D). Black line is mean, error bars are SEM.

