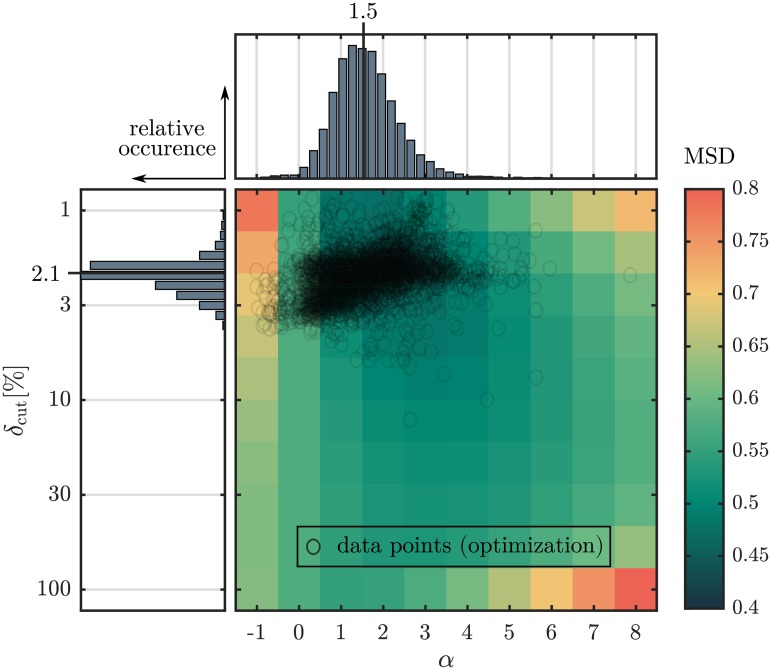
Fig 5. Effect of evaluation parameters δcut and α on the error.
False colours indicate the mean squared difference MSD between the computed angular distributions and their reference on a subset of N = 103 images for a discrete set of 10 × 10 parameter values. Data points represent the optimal parameter set for each image (N = 104) based on the exploited two parameters Nelder-Mead optimization algorithm which used the squared difference between reference and calculated orientation distribution as objective function. Histograms show the frequency distribution of parameter δcut and α. The median values of both distributions(δcut = 2.1%, α = 1.5) were identified as optimal evaluation parameters. The mean number of iterations, until the termination criterion was met, is 23 ± 9. Only 0.2% of the images reached the maximum number of iterations, which was set to 100.

