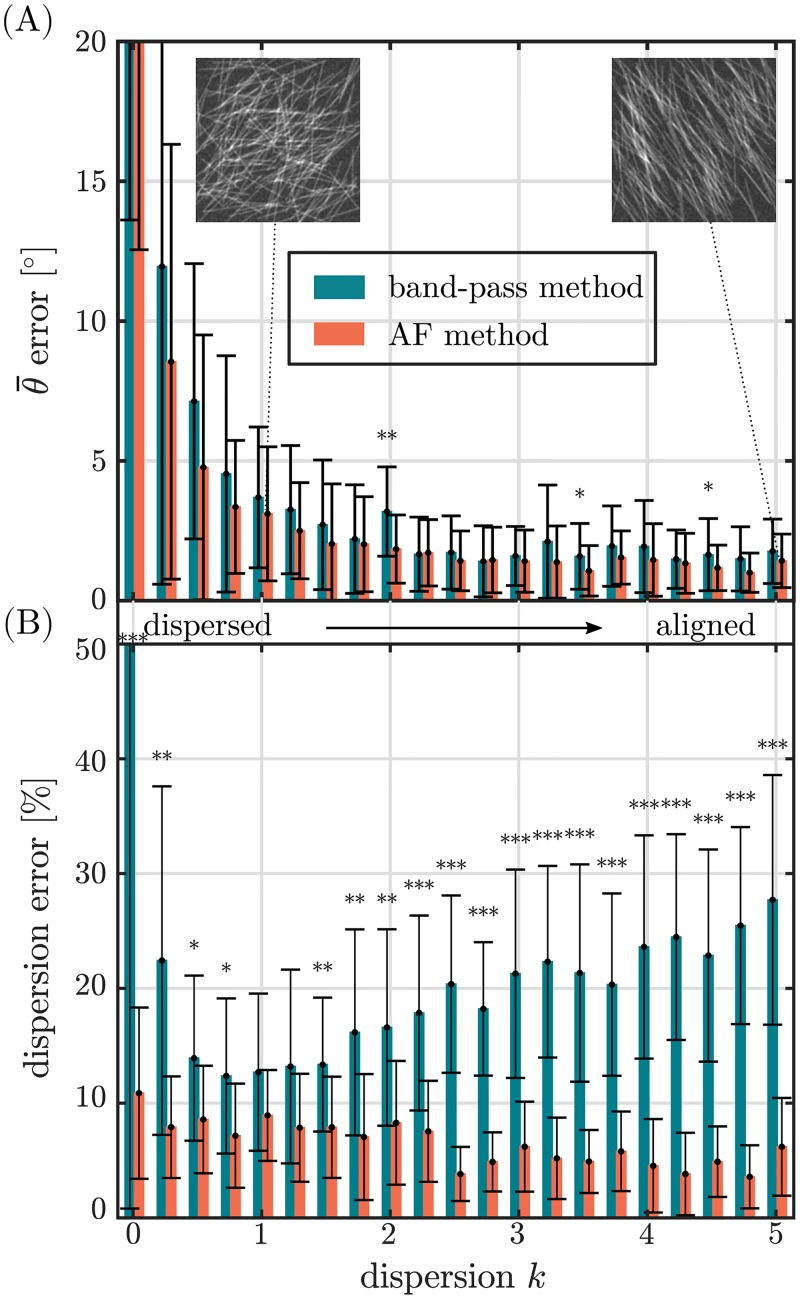
Fig 6. Error of the band-pass method and the AF method vs. the dispersion k of the fiber network.
Fibers with a width of 5, aspect ratio of 30 and an image noise factor of 1 were considered here. (A) shows the error of the mean fiber orientation . Inlets show exemplary Monte-Carlo generated greyscale fiber images from respective distributions. (B) shows the relative error of the fiber dispersion parameters Δkrel, Δbrel. Sample greyscale images, that were simulated by the implemented Monte-Carlo method are shown for k = 0.01 and k = 5. (*p < 0.05, **p < 0.01, ***p < 0.001).

