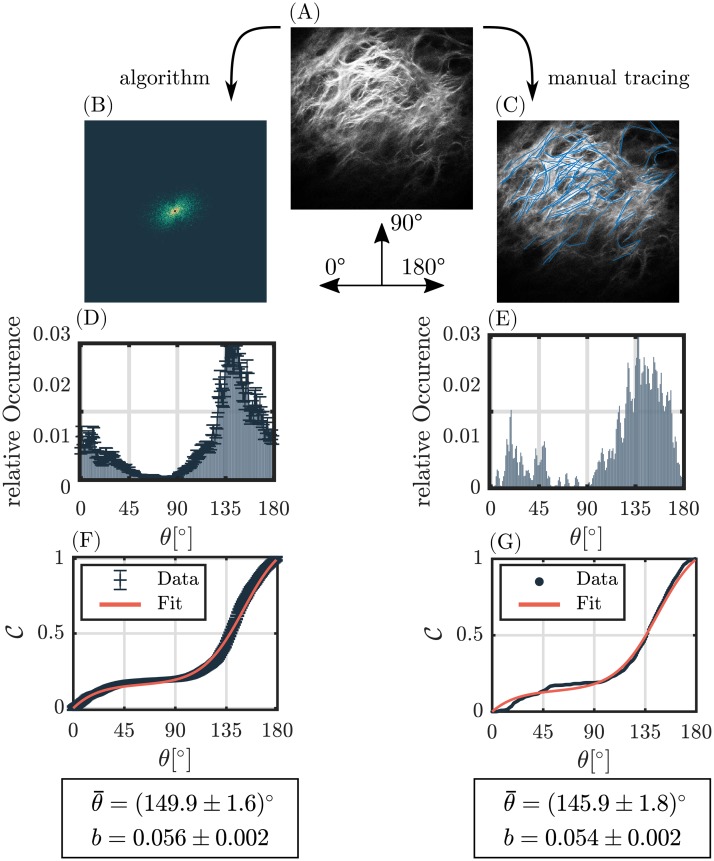
Fig 8. Evaluation example of an in vivo SHG-image of dermal collagen.
Left column ((B),(D),(F)): Evaluation steps of the implemented image processing algorithm. Right column ((C),(E),(G)): Manual fiber tracing of fibers, which serves as ground truth. (A) shows the original SHG-image as measured with the multi-photon microscope. (B), the filtered power spectrum for δcut = 2.1%. (C), manually traced fibers. (D) and (E) show the resulting angular orientation distributions. For (D), α = 1.5 was used. (F) and (G) show the respective cumulative orientation distributions and the fit parameters obtained from sigmoid fitting.

