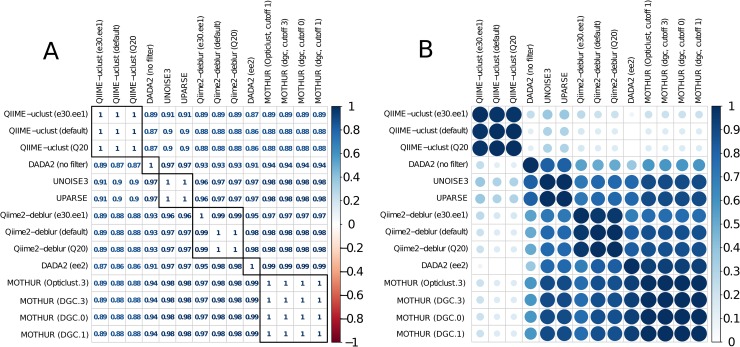
Fig 6. Spearman's rho correlation averaged across all samples of the HELIUS fecal sample dataset (N = 2170).
A) Actual values. B) Values scaled to range between 0 and 1. Hierarchical clustering was applied to both rows and columns in order to group pipelines based on the degree of correlation of their outputs.

