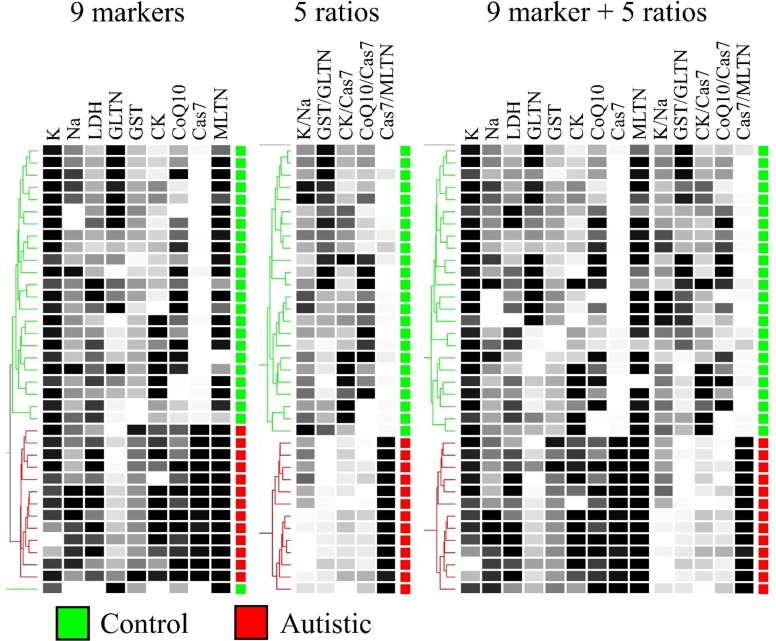
Fig 4. Hierarchical clustering of participants based on 9 biomarkers, 5 biomarker ratios, or both.
Data were collected from 13 autistic patients and 24 age-matched controls. Pairwise similarities were based on Canberra distances (Eq 1) and dendrograms were constructed using the Unweighted Pair Group Method with Arithmetic Mean (UPGMA) algorithm. K: potassium, Na: sodium, LDH: lactate dehydrogenase, GSH: glutathione, GST: glutathione S-transferase, CK: creatine kinase, CoQ10: co-enzyme Q10, Cas7: caspase 7, and MLTN: melatonin.

