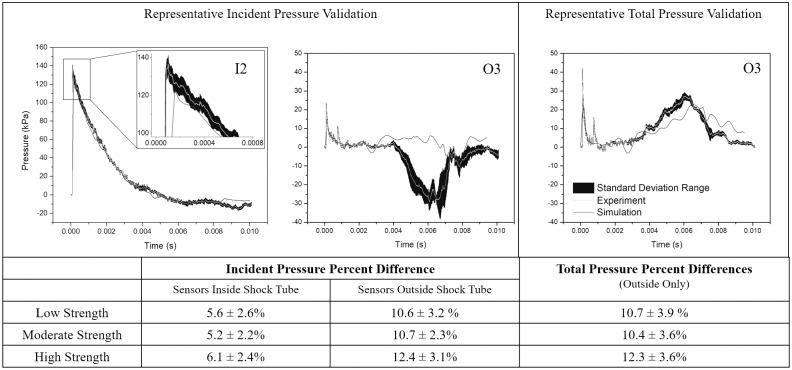
Fig 6. Simulation predictions compared to experimental results for the high-strength shock.
The simulated pressures (grey) showed good validation with the average experimentally measured pressures (black with grey, mean, with standard deviation) for the incident (left and middle) and total (right) pressure measurements for the high strength shock. The point-by-point percent error for the shock front was under 12.5%. Average errors for interior locations (I2-I4, I6, and I8) showed the best validation.

