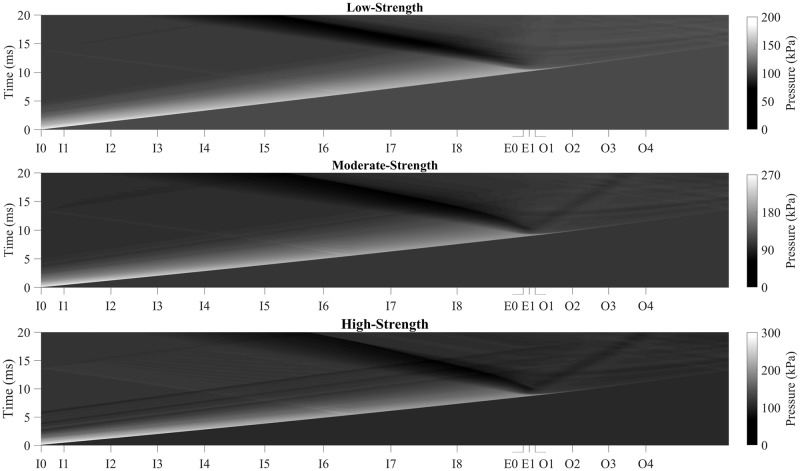
Fig 12. Pressure-time contour plots along the longitudinal axis.
A surface map of the pressure for each node along the longitudinal axis plotted as longitudinal location vs. time, shows a rarefaction wave for the (top) low strength, (middle) moderate-strength, and (bottom) high-strength shock. The posteriorly traveling dark fan shows the region of low pressure, which is characteristic of the rarefaction wave.

