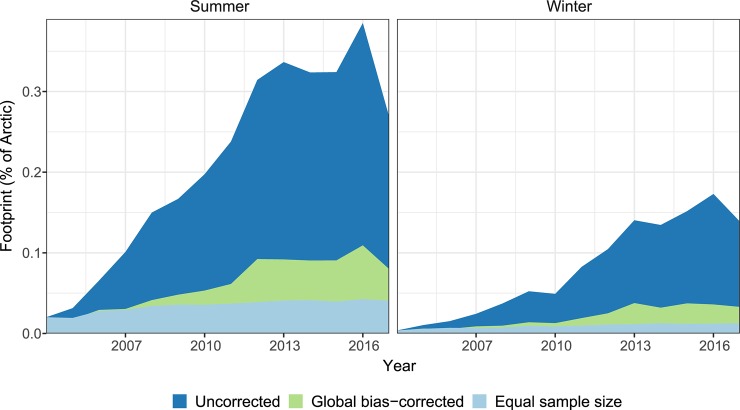
Fig 1. Footprint of Arctic tourism.
The total footprint of Arctic tourism measured from Flickr data increased between 2004 and 2017 (Uncorrected Arctic footprint, darker blue), even after adjusting for the global rise in Flickr use during this period (Global-bias corrected, green). The relative footprint per tourist (Equal sample size, pale blue) also increased slightly over this time. Similar trends are seen in summer and winter, though the tourism footprint in winter is approximately half the magnitude of that in summer. The footprint is defined as the percentage of 5 km hexagonal grid cells within the Arctic region visited by at least one Flickr user per year. The 2017 decline should be interpreted with caution as it may in part be an artefact of the timing of our data download and the lag between photos being taken and their being uploaded to Flickr.

