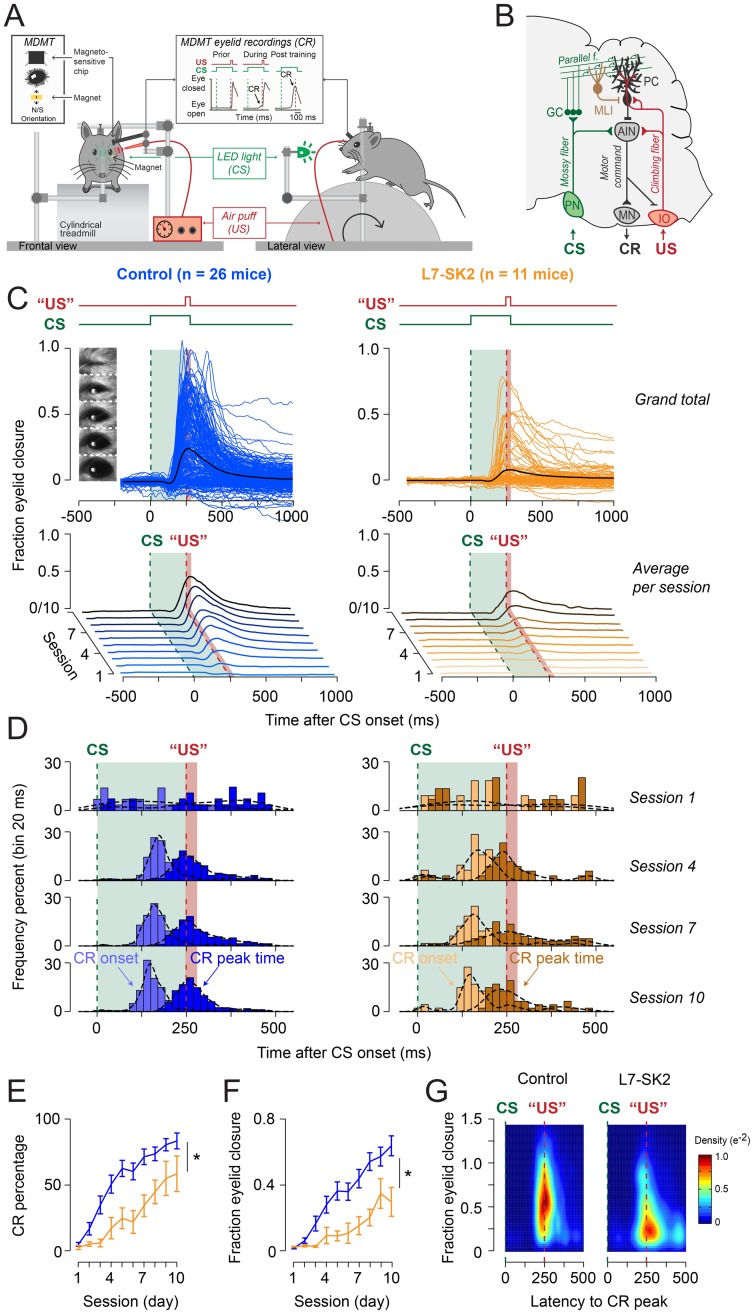
Fig 7. L7-SK2 mice show impaired EBC.
(A) During EBC, mice are placed in a light- and sound-isolating chamber on a freely moving foam treadmill with their head fixed to a horizontal bar. Mice see a green LED light (CS), followed 250 ms later by a weak air puff on the eye (US). As a result of repeated CS–US pairings, mice will eventually learn to close their eye in response to the CS, which is called the CR. Eyelid movements were recorded with the MDMT. (B) During Pavlovian EBC, memory formation takes place in PCs of defined areas of the cerebellar cortex. These PCs receive inputs from the mossy fiber–PF system, which conveys sensory CS signals (green) and input from a single CF, which transmits the instructive US signal (red). During the conditioning process, these PCs acquire a well-timed suppression of their simple spike firing in response to the CS, thereby temporarily disinhibiting the cerebellar nuclei, which drives the overt eyeblink CR. (C) Upper panels: session-averaged (colored) eyeblink traces per mouse and grand total averaged (black) eyeblink traces during CS-only trials (total per panel 10 × 26 traces for control mice, 10 × 11 traces for L7-SK2 mice). Mouse eye video captures show eyelid closure ranging from 0 (fully open) to 1 (fully closed). Lower panels: waterfall plot showing the averaged eyeblink trace per group per session. (D) Peristimulus histogram plots with a Gaussian kernel density estimate (black dashed line) showing the distribution of CR onset (light filled bars) and CR peak time (dark filled bars) relative to CS and US onset in CS-only trials for sessions 1, 5, 10, and 15. In both groups, there is a clear development in CR onset and peak time: there are no clearly preferred times in the CS–US interval at the start of training (session 1), but during training, CR onset values are centered around 100–125 ms after CS onset, and CR peak times are located around the onset of the expected US. Although L7-SK2 plots look a little noisier, no significant difference could be established in any session for the mean value and/or standard deviation. Green dashed line is CS onset, red dashed line is US onset; light green and light red fill indicate CS and US duration, respectively. (E, F) L7-SK2 mice have lower CR percentage and FEC (or “amplitude of eyelid closure”) over the 10 acquisition sessions. (G) Two-dimensional density plot showing the fraction of eyelid closure relative to the latency to the CR peak over all sessions. The main impairment of L7-SK2 is in the spatial domain (i.e., amplitude or FEC) and less in the temporal domain (i.e., timing of CR peak). See also S5 Table. AIN, Anterior Interposed Nucleus; CF, climbing fiber; CR, conditioned response; CS, conditioned stimulus; EBC, eyeblink conditioning; FEC, fraction eyelid closure; GC, granule cell; IO, Inferior Olive; LED, light-emitting diode; MDMT, magnetic distance measurement technique; MLI, molecular layer interneuron; MN, motor neuron; NVE, NVE Corporation magnetic sensor; PC, Purkinje cell; PF, parallel fiber; PN, Pontine Nuclei; US, unconditioned stimulus.

