
FIGURE 2.
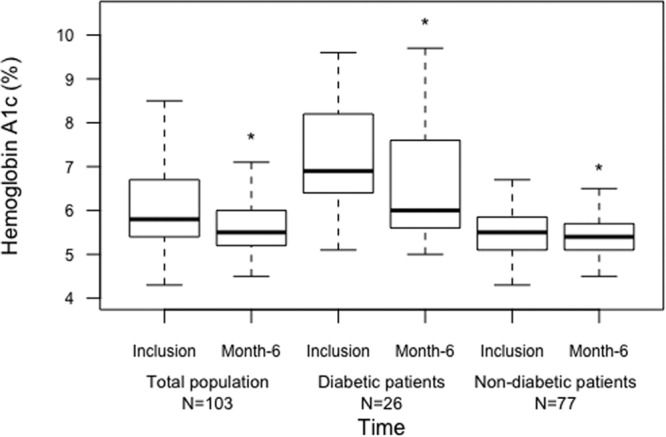
Improvement in HbA1c at 6 mo post–belatacept conversion. Box plots represent HbA1c percentage at inclusion for each patient and at 6 mo. Black lines represent the average. *P < 0.05 as compared with inclusion. HbA1c, hemoglobin A1c.
Official websites use .gov
A
.gov website belongs to an official
government organization in the United States.
Secure .gov websites use HTTPS
A lock (
) or https:// means you've safely
connected to the .gov website. Share sensitive
information only on official, secure websites.
Improvement in HbA1c at 6 mo post–belatacept conversion. Box plots represent HbA1c percentage at inclusion for each patient and at 6 mo. Black lines represent the average. *P < 0.05 as compared with inclusion. HbA1c, hemoglobin A1c.