
Figure 6.
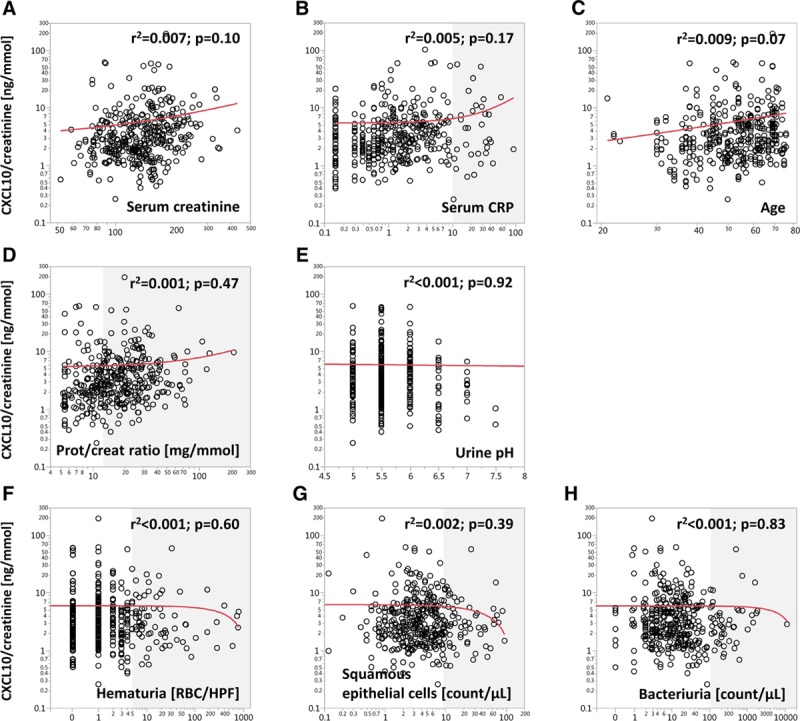
Correlation of CXCL10/creatinine ratios with clinical blood and urine parameters as potential confounders. For this analysis, only samples with Lc < 5 and no Decoy cells were included (n = 382). The gray shades indicate values outside of the normal range. CXCL10, C-X-C motif chemokine 10; Lc, leucocyturia.