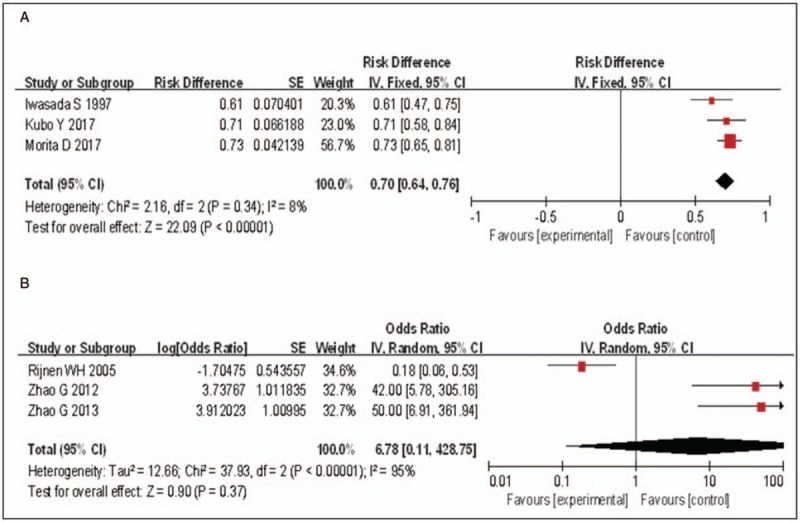
Figure 4.

Forest plot showing hip survival rate (with radiographic failure as the endpoint) 5 years after TRO. (A) Forest plot showing hip survival rate (with radiographic failure as the endpoint) 5 years after TRO (cohort studies, Method 1). (B) Forest plot showing hip survival rate (with radiographic failure as the endpoint) 5 years after TRO (cohort studies, Method 2). CI: Confidence intervals; df: Degrees of freedom; IV: Inverse variance; SE: Standard error; TRO: Transtrochanteric rotational osteotomy.
