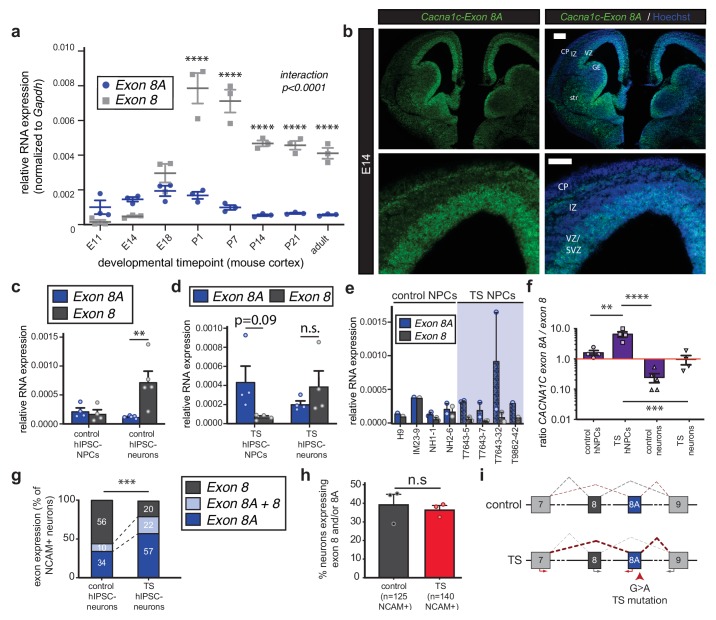
Figure 1. The TS mutation alters CACNA1C mRNA splicing and induces persistent expression of mutant channels in differentiating human neurons.
(a) qRT-PCR quantifying relative abundance of Cacna1c exons 8 and 8A in developing mouse cortex (n = 3 mice per timepoint from two different litters; data presented as mean ± s.e.m.; ****p<0.0001, two-way ANOVA and post-hoc Bonferroni). (b) Representative fluorescence ISH images of coronal sections through developing mouse brain at E14 depict strong expression of Cacna1c-8A transcripts in neurogenic zones lining the ventricles, in newborn neurons of the CP, and in the developing striatum. VZ, ventricular zone; SVZ, subventricular zone; IZ, intermediate zone; CP, cortical plate; GE, ganglionic eminence; and str, striatum. Scale bars, 200 μm (upper), 100 μm (lower). (c) qRT-PCR on RNA from differentiating human iPSC-derived NPCs. CACNA1C-8 transcripts are upregulated during neuronal differentiation in control cultures (NPCs: two subjects and H9 ES line, four lines total; neurons: two subjects and H9 ES line, five lines total; normalized data (to GAPDH) presented as mean across lines ± s.e.m.; **p<0.005, two-way ANOVA and post-hoc Bonferroni). (d) qRT-PCR on RNA from differentiating human TS iPSC-derived NPCs or neurons demonstrates that upregulation of exon 8 is abrogated during neuronal differentiation of TS patient-derived neurons (TS NPCs and neurons: two patients, four lines; T7643-5, T7643-7, T7643-32, and T9862-42; normalized data (to GAPDH) presented as mean across lines ± s.e.m.; n.s., not significant, two-way ANOVA). (e) The relative abundance of CACNA1C exons 8 and 8A in NPC cultures is shown separately for H9 ES line, three lines from two healthy individuals (IM23-9, NH1-1 and NH2-6), and four TS lines from two individuals (T7643-5, T7643-7, T7643-32, and T9862-42). Data points indicate individual differentiations. In all TS lines examined, exon 8A is more highly expressed than exon 8 in NPCs. (f) The ratio of exon 8A to exon 8 decreases in differentiating control neurons, while TS NPCs show an increased exon 8A/exon 8 ratio (data presented as mean ± s.e.m.; **p<0.005, ***p<0.001, ****p<0.0001, one-way ANOVA and post-hoc Bonferroni). (g, h) Single-cell qRT-PCR using Fluidigm arrays of neuronal cultures at day 45 of differentiation reveals a greater proportion of neurons expressing CACNA1C-8A in TS patients compared to controls (g), (n = 125 control neurons, n = 140 TS neurons from three control and three patient lines; ***p<0.001, χ2 = 27.36, Chi-square test). (h) The percentage of neurons in patients and controls remains the same, as assessed by NCAM expression (Fluidigm arrays; data presented as mean ± s.e.m., p=0.66, n.s., not significant, unpaired t-test). (i) A working model depicting the splicing shift caused by the TS mutation in a schematized version of the CACNA1C genomic locus spanning exons 7 to 9.


