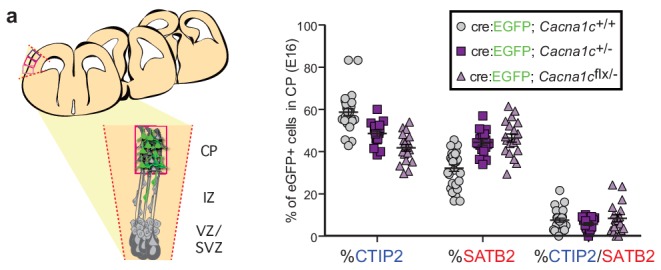
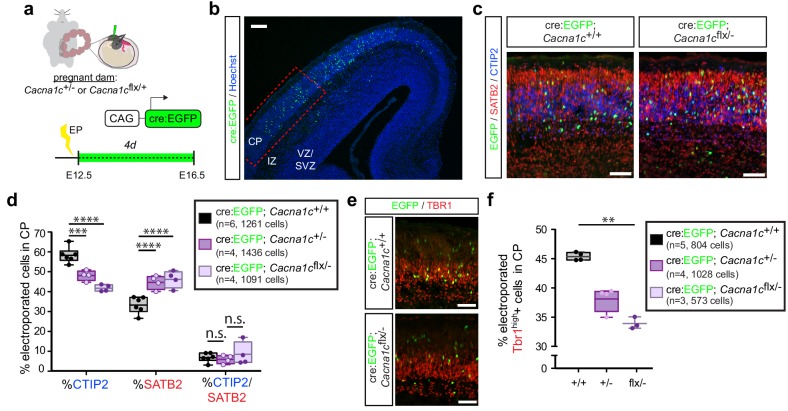
Figure 4. Cav1.2 loss of function results in increased SATB2+ cells and decreased CTIP2+ cells in the CP.
(a) Schematic depicting the time course of in utero loss-of-function experiments. (b) Expression of cell-type-specific transcription factors was quantified in EGFP+ cells in the CP of E16.5 embryos electroporated with Cre:EGFP at E12.5, in the region marked by the dotted red box. VZ, ventricular zone; SVZ, subventricular zone; IZ, intermediate zone; and CP, cortical plate. Scale bar, 100 μm. (c) Representative coronal sections immunostained for EGFP (green), SATB2 (red) and CTIP2 (blue) through the CP of WT and Cacna1cflx/- -electroporated embryos at E16.5. Scale bar, 50 μm. (d) Cav1.2 loss of function results in reduced CTIP2-expressing EGFP+ cells with a concomitant increase in SATB2+ cells. (Cacna1c+/+, n = 6 mice, 1261 cells; Cacna1c+/-, n = 4 mice, 1436 cells; Cacna1cflx/-, n = 4 mice, 1091 cells; data presented as box and whisker plot, box bounds the IQR divided by the mean and whiskers extend to the minimum and maximum value; ****p<0.0001, two-way ANOVA and post-hoc Bonferroni.) (e) Representative coronal sections immunostained for EGFP (green) and TBR1 (red). Scale bar, 50 μm. (f) Cav1.2 loss of function results in a modest reduction in TBR1+ electroporated cells. (Cacna1c+/+, n = 5 mice, 804 cells; Cacna1c+/-, n = 4 mice, 1028 cells; Cacna1cflx/-, n = 3 mice, 573 cells; data presented as box and whisker plot as in (d); **p<0.01, Kruskal-Wallis test and post-hoc Dunn’s correction, mean rank compared to Cav+/+.).
Figure 4—figure supplement 1. Cav1.2 loss-of-function in utero electroporation experiments.


