. 2020 Jan 16;9:e50960. doi: 10.7554/eLife.50960

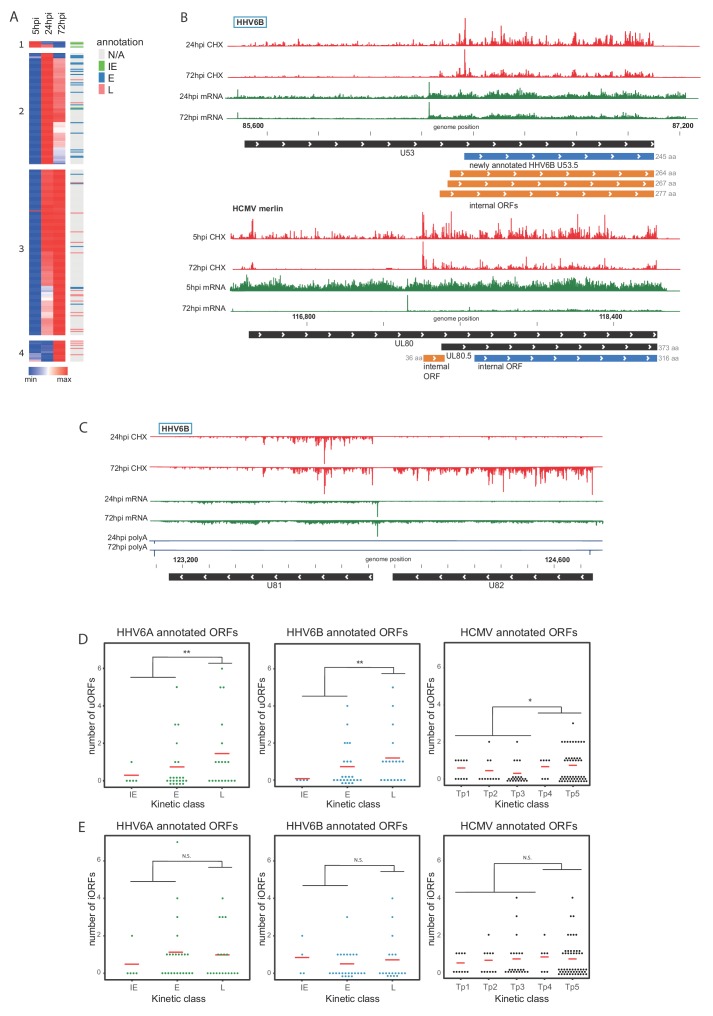
Figure 7. Temporal regulation of viral gene expression is driven by pervasive use of alternative 5’ ends.

(A) Heatmap of ribosome occupancy of HHV-6B ORFs clustered by relative expression levels at 5, 24 and 72hpi. Previously annotated kinetic class were labeled on the right as immediate early (IE, green), early (E, blue), late (L, pink), or unknown (N/A, gray). The cluster number appears on the left. (B and C) The ribosome occupancy (red) and mRNA profiles (green) are shown (B) around U53 loci at different hours post infection (marked on the left) and around its HCMV homolog, UL80 (C) and around U81 and U82 loci. (D and E) Dot plots showing the number of uORFs (D) and iORFs (E) of each canonical viral ORF with annotated kinetic class for HHV-6A, HHV-6B and HCMV. P-value was calculated using proportion test. * for p-value<0.05, ** for p-value<0.01 and N.S for non-significant.

Figure 7—source data 1. CHX Ribo-seq density and kinetic clusters of SVM predicted HHV-6B ORFs.
Figure 7—source data 2. Internal and upstream ORFs of previously annotated HHV-6A and HHV-6B ORFs and their HCMV homologs.

Figure 7.

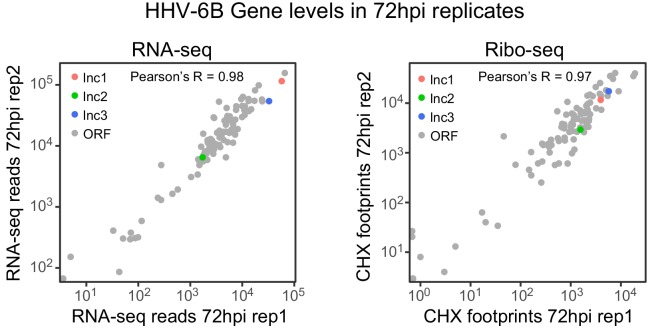
Figure 7—figure supplement 1. RNA abundance and ribosome footprint coverage correlate well between replicates.

Figure 7—figure supplement 1.

Scatter plot of RNA-seq and CHX Ribo-seq reads of canonical HHV-6 ORFs and novel lncRNAs. Gray dots represent ORFs, colored dots represent lncRNAs (lncRNA1 in red, lncRNA2 in green and lncRNA3 in blue).
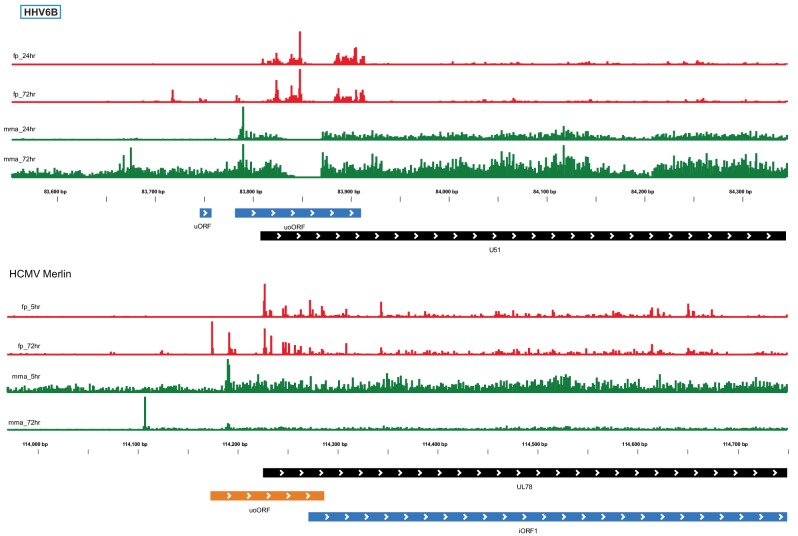
Figure 7—figure supplement 2. Conserved temporal regulation of translation from uoORF.

Figure 7—figure supplement 2.

The ribosome occupancy and mRNA profiles are shown around the HHV-6B U51 locus and the UL78 HCMV locus, at different infection times (marked on the left). CHX Ribo-seq reads are presented in red and RNA-seq reads are presented in green. Black rectangles represent canonical annotations, blue rectangles represent novel ORF initiating at an AUG codon and in orange rectangles represent ORFs initiating at a near-cognate start codon.
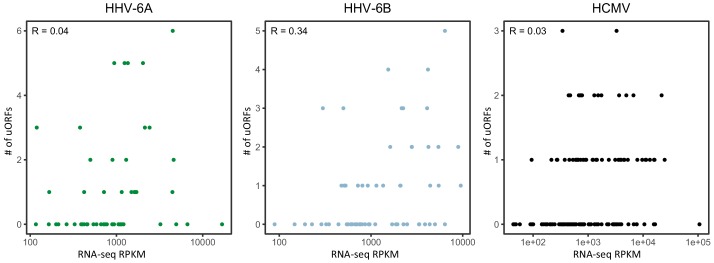
Figure 7—figure supplement 3. Number of uORFs as a function of RNA abundance.

Figure 7—figure supplement 3.

Scatter plots showing the number of uORFs of each main ORF (Y axis) as a function of the RNA expression level of the same ORF as measured by RNA-seq (X axis). Pearson's correlation coefficient R is displayed for each virus.
Figure 7—figure supplement 4. Enrichment of non-AUG start codons at late time points post infection.
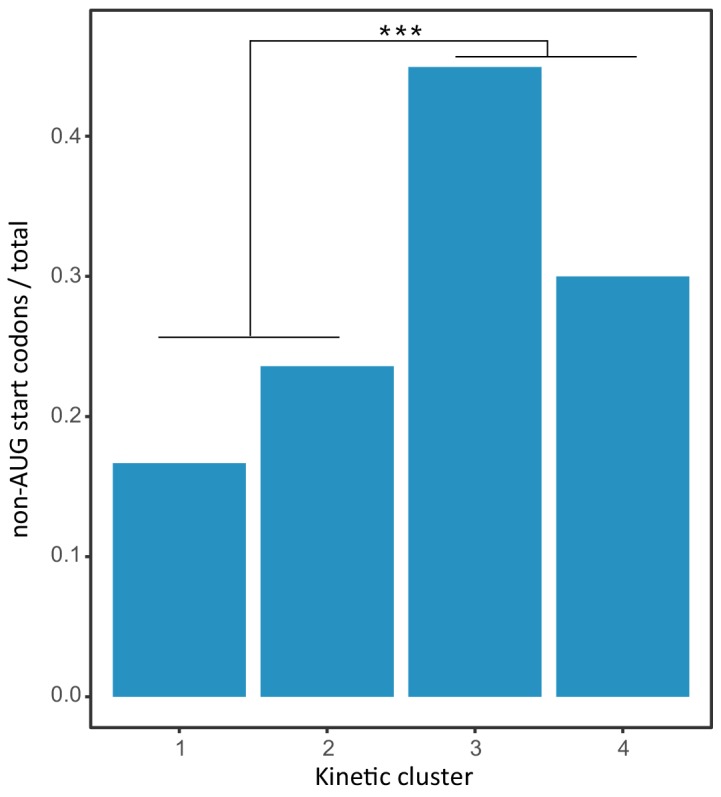
Figure 7—figure supplement 4.

The ratio of HHV-6B ORFs initiating and non-AUG start codons in each kinetic cluster (early clusters 1,2 and late clusters 3,4). P-value was calculated using proportion test. *** for p-value<0.001.