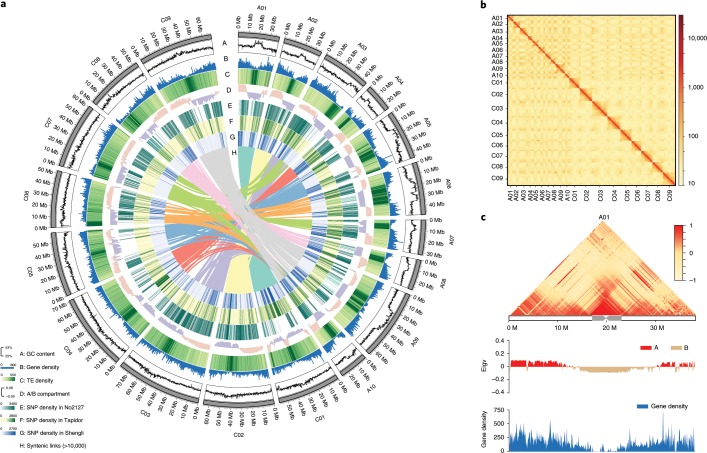
Fig. 1. Features of the B. napus genome.
a, Circos plot of the multidimensional topography for B. napus ZS11 genome. A–H, Concentric circles from outermost to innermost, show GC content (A), gene density (B), TE density (C), A/B compartment (D), SNP density in No2127 (E), SNP density in Tapidor (F), SNP density in Shengli (G) and syntenic regions between the A and C subgenomes (H). b, Genome-wide contact matrix of ZS11 genome. The colour intensity represents the frequency of contact between two 500 kb loci. c, Interaction frequency, A/B compartment and gene density in ZS11 chromosome A01. The colour scale represents the Pearson’s correlation coefficient of normalized interaction matrix. Eigv, eigenvector value of correlation matrix.

