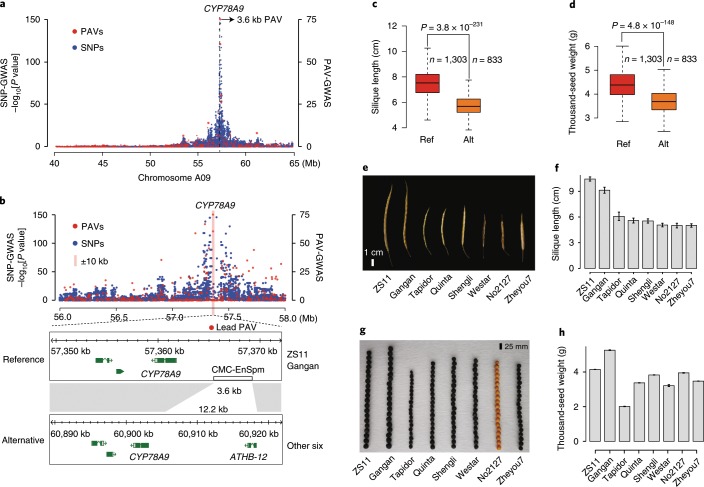
Fig. 4. GWAS of silique length and seed weight in the NAM population.
a, Manhattan plots of SNP-GWAS and PAV-GWAS for silique length. b, A 3.6-kb CACTA-like insertion as lead PAV of BnaA09.CYP78A9 promoter region. c, The silique length in lines with different CYP78A9 alleles. For a and b, the GWAS (-lmmm 1: Wald test) was performed with 3,971,412 SNPs or 27,216 PAVs in the BN-NAM population containing 2,141 RILs. d, Thousand-seed weight in lines with different CYP78A9 alleles. For c and d, P values were determined using two-tailed Student’s t-tests. The middle bars represent the median while the bottom and top of each box represent the 25th and 75th percentiles, respectively. The whiskers extend to 1.5 times the interquartile range. Alt, alternative; Ref, reference. e,f, Phenotype data of silique length in eight B. napus accessions. g,h, Phenotype data of seed weight in eight assembled B. napus accessions. For e and g, experiments were repeated five times with similar results. For f and h, data are mean ± s.d. of eight and five biological replicates, respectively.

