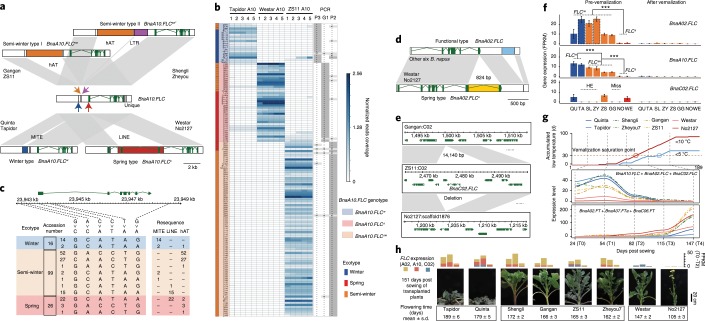
Fig. 6. Structural variations detected in BnaA10.FLC, BnaA02.FLC and BnaC02.FLC.
a, Insertions of four transposable elements around BnaA10.FLC in different ecotypes. b, Genotyping BnaA10.FLC in 141 B. napus accessions. The left were ecotypes of B. napus accessions. The middle is the read coverage of resequencing data in 15 representative sites, with Tapidor A10: 22,661,433–22,661,437; Westar A10: 23,731,730–23,731,734 and ZS11 A10: 23,942,298–23,942,302. The right is the PCR results statistics of three insertions. c, The haplotypes of six SNPs and three TEs around BnaA10.FLC in 141 B. napus accessions. d,e, SVs in BnaA02.FLC (d) and BnaC02.FLC (e) in eight accessions. f, The expression levels of BnaA02.FLC, BnaA10.FLC and BnaC02.FLC in plants before and after vernalization (T0 and T4) based on the number of fragments per kilobase of the exon model per million mapped reads (FPKM). ***P < 0.001 (two-tailed Student’s t-test). Error bars indicate the mean ± s.d. (n = 2). ns, not spring; w, winter; s, spring; sw, semi-winter. g, The relationship between the accumulated days with low temperature, the cumulative expression levels of FLCs, FTs and flowering time in the 2018–2019 growing season in Wuhan. Three expressed FT genes were considered (average FPKM ≥ 1). Accumulated low-temperature curves indicated that the end of vernalization was in T2–T3 for SORs and T3–T4 for WORs. h, The cumulative expression levels of three FLC genes and the flowering time characterization of eight assembled B. napus accessions. Stacked histogram showed FLCs expression in T0–T3. These plants were transplanted from the field to the pot at 106 d after sowing. The standard deviation and average of flowering time were counted from 14–21 lines.

