FIGURE 1.
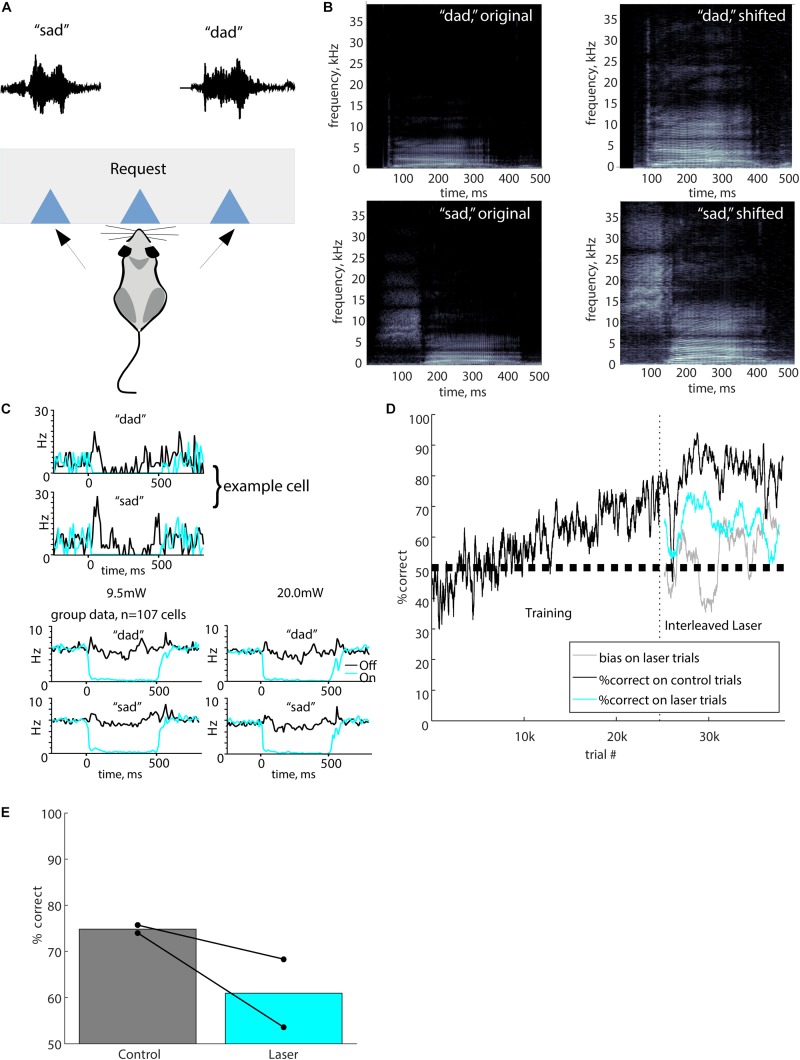
Full stimulus suppression. (A) The port mapping for this task involved a central lick to initiate a trial, which triggered playback of either “sad” or “dad.” The waveforms for the “sad” and “dad” stimuli shown above the corresponding response port. A reward for a correct response was delivered at the response port. (B) Spectrograms of the original human voice recordings of “dad” and “sad” are shown alongside the pitch-shifted (up one octave) stimuli used for behavioral testing. In all plots, grayscale represents the power spectral density (dB/Hz), with black representing -110 dB/Hz and white representing -30 dB/Hz. (C) Optogenetic suppression produced nearly complete silencing of neurons in auditory cortex. The upper panels show responses of an example cell to the speech stimuli used in the task (black), and complete suppression of these responses by laser illumination (cyan, 500 ms at 9.5 mW). Both stimulus and laser onset occurred at time 0. Bottom panels show group data averaged across 107 cells in two mice, at both 9.5 and 20 mW laser powers. Cells were recorded with chronic tetrodes in two awake mice that were not used for behavior. (D) Performance of a typical mouse from initial training stages through laser suppression. Vertical dashed line indicates the onset of laser trials. Performance is represented as percent correct averaged across both stimuli in a 200-trial sliding window. Black, performance on control trials; cyan, performance on laser trials; gray, bias on laser trials. (E) Performance in overall percent correct for each mouse for 10,000 total trials is represented by connected dots representing control trials and suppression trials. Bars show mean performance for each trial type across both mice.

