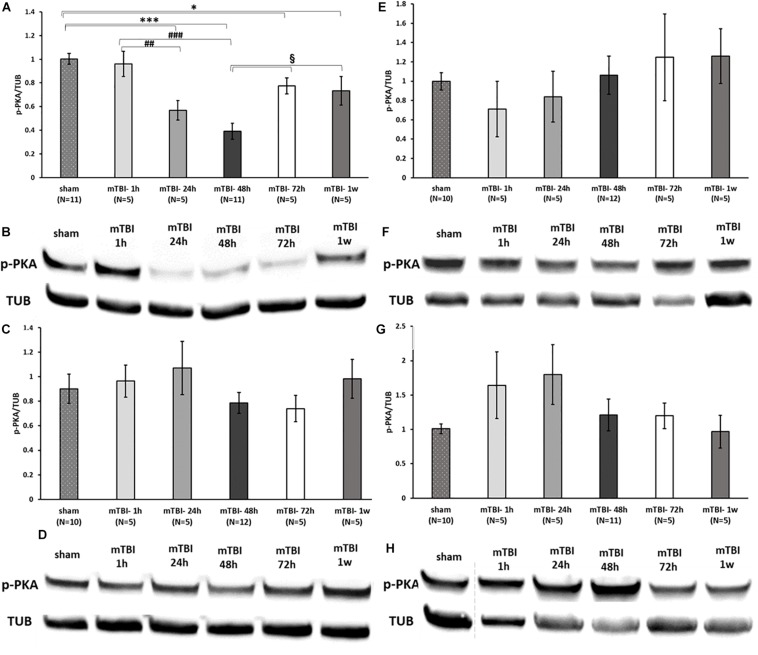
FIGURE 7.
mTBI results in a decline in p-PKA levels in ipsilateral cortex. Graphs presenting p-PKA expression in ipsilateral/right (A) and contralateral/left (C) cortex and ipsilateral (E) and contralateral (G) hippocampus in sham and 1 h to 1 week following mTBI. One-way ANOVA followed by Fisher’s LSD post hoc analysis revealed a significant reduction in p-PKA expression in cortex right 24 h to 1 week following mTBI [A: F(5,36) = 12.060; p < 0.001, ∗∗∗p < 0.001 sham vs. 24, 48 h and ∗p < 0.05 sham vs. 72 h, 1 w], ##p < 0.01, ###p < 0.001 mTBI 1 h vs. mTBI 24 h and vs. 48 h, respectively, when the maximal reduction present in 48 h was followed by an elevation in the levels of PKA (72 h–1 week, §p < 0.05 vs. 48 h). Blots from all other regions remained unchanged by the injury [C: F(5,36) = 0.809; NS, E: F(5,36) = 0.585; NS, G: F(5,35) = 1.373; NS]. Values are mean ± SEM. (B,D,F,H) Representative images of gel electrophoresis followed by immunoblot analysis using antibodies against p-PKA and α-tubulin in ipsilateral cortex, contralateral cortex, ipsilateral hippocampus, and contralateral hippocampus, respectively. A crop of the original image was performed in 7F at loading site number 2 of the gel due to an abnormal value of a control sample that was therefore excluded from the statistical analysis.

