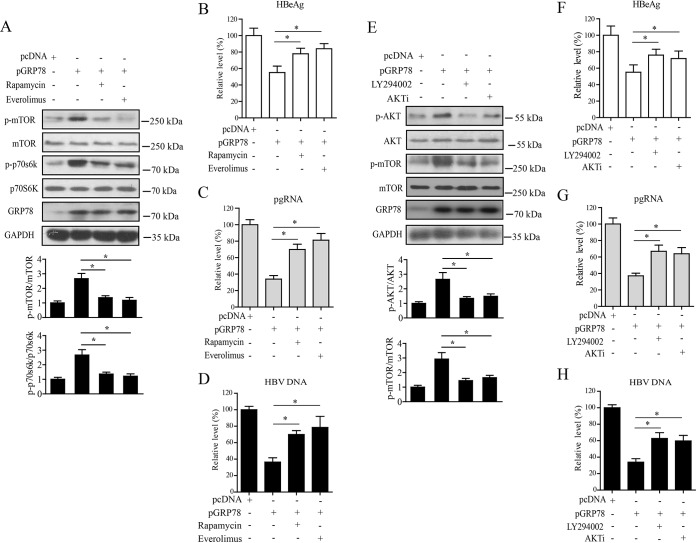
FIG 6.
AKT/mTOR signaling was involved in GRP78-mediated inhibition of HBV replication. (A) HepAD38/Tet-off cells were transfected with pGRP78 for 48 h, followed by treatment with rapamycin (100 nM) or everolimus (100 nM) for another 24 h. The cells were then subjected to Western blotting with antibodies against p-mTOR, mTOR, p-p70S6K, p70S6K, GRP78, and GAPDH. (Lower panel) The relative levels of p-mTOR to mTOR or p-p70s6K to p70s6K were examined by densitometric analysis, and the value from empty vector-transfected cells was set at 1.0. The data are means ± the SEM of five samples pooled from three independent experiments. *, P < 0.05. (B to D) Cells were treated as in panel A. The levels of HBeAg (B), pgRNA (C), or HBV-DNA (D) were determined by ELISA, qRT-PCR, and qPCR, respectively. The data are means ± the SEM of five samples pooled from three independent experiments. *, P < 0.05. (E) HepAD38/Tet-off cells were transfected with pGRP78 for 48 h, followed by treatment with LY294002 (10 μM) or AKTi (10 μM) for another 24 h. The cells were then collected and subjected to Western blotting with antibodies against p-AKT, AKT, p-mTOR, mTOR, GRP78, and GAPDH. (Lower panel) The relative level of p-AKT to AKT or p-mTOR to mTOR was examined by densitometric analysis, and the value from empty vector-transfected cells was set at 1.0. The data are means ± the SEM of four samples pooled from three independent experiments. *, P < 0.05. (F to H) Cells were treated as for panel E. The levels of HBeAg (F), pgRNA (G), or HBV DNA (H) were determined as in panels B to D. The data are means ± the SEM of five samples pooled from three independent experiments. *, P < 0.05.

