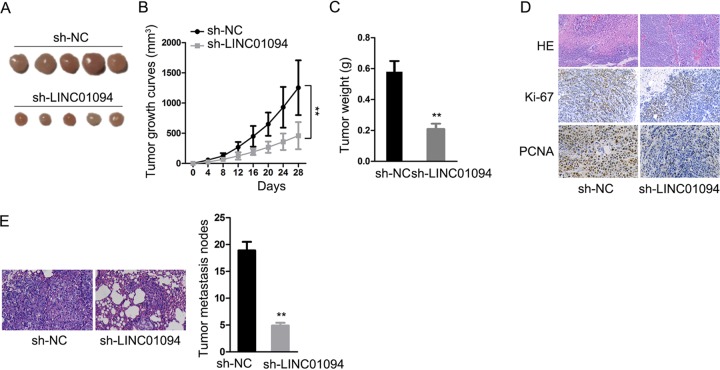
FIG 6.
(A) Four weeks after injection, tumors were dissected from nude mice and photos were taken. (B) The growth of tumors in differently transfected cells is displayed in a line chart (**, P < 0.01 [two-way ANOVA]). (C) Tumor weights were measured (**, P < 0.01 [Student t test]). (D and E) Immunohistochemical staining shows the extent of tumor metastasis under different conditions (**, P < 0.01 [Student t test]).

