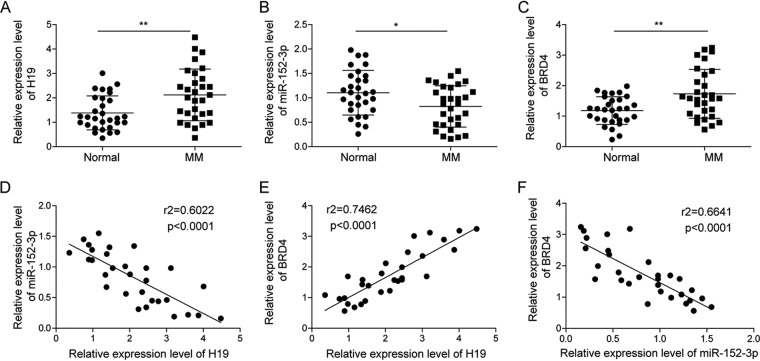
FIG 1.
Expression level of H19, miR-152-3p, and BRD4 in MM tissues. Expression of H19 (A), miR-152-3p (B), and BRD4 (C) was detected by qRT-PCR in plasma of 30 patients with or without MM. (D) Spearman’s correlation analysis between H19 and miR-152-3p expression level. (E) Spearman’s correlation analysis between H19 and BRD4 expression level. (F) Spearman’s correlation analysis between miR-152-3p and BRD4 expression level. Each data point represents fold change for real-time PCR. *, P < 0.05; **, P < 0.01.

