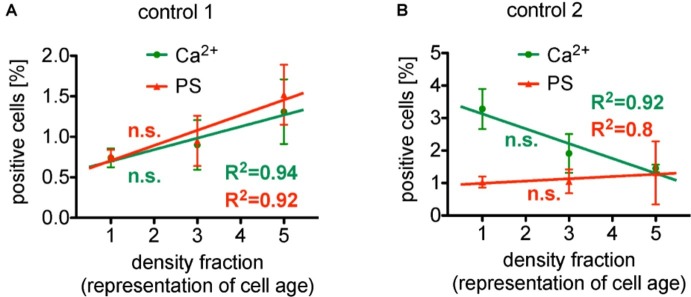
Figure 1.
Reanalysis of data initially presented in Wesseling et al. (2016b). In the original publication, all fractions were only compared in pairs, while here we followed the approach to plot (and analyze) the measured effect in dependence of the cell age. Both panels present the situation under control conditions (without pharmalogical stimulation). (A) The percentage of erythrocytes showing increased Ca2+ content as well as phosphatidylserine exposure depicts a linear behavior in dependence of cell age with a very good regression, R2 given in the figure. However, the slope of these linear regressions failed to be significantly different from zero, i.e., failed to show a significant change. (B) The percentage of erythrocytes showing decreased Ca2+ content, while phosphatidylserine exposure depicts a linear increase in dependence of cell age, again, with a very good regression, R2 given in the figure. The slope of both linear regressions also failed to be significantly different from zero, i.e., failed to show a significant change. Furthermore, comparing the particular fractions between the two measurements (A,B) applying an unpaired t-test with Welch’s correction (unequal SD values), none of the fractions showed a significant difference (p > 0.05). Both measurements (A,B) were performed in the same laboratory. Blood samples were given from healthy sportsmen (Department of Sports Medicine) with an age between 18 and 36 years. Each data point consists of three donors (not identical between A and B) and for each donor and condition, 90,000 cells were analyzed by flow cytometry. The only obvious difference is the composition of the solutions. [(A) in mM]: 145 NaCl, 7.5 KCl, 2 CaCl2, 10 glucose, 10 HEPES, pH 7.4 (Tyrode solution); [(B) in mM]: 125 NaCl, 5 KCl, 1 CaCl2, 1 MgCl2, 5 glucose, 32 HEPES, pH 7.4 (Ringer solution). (A) A reprint from Bernhardt et al. (2019).

