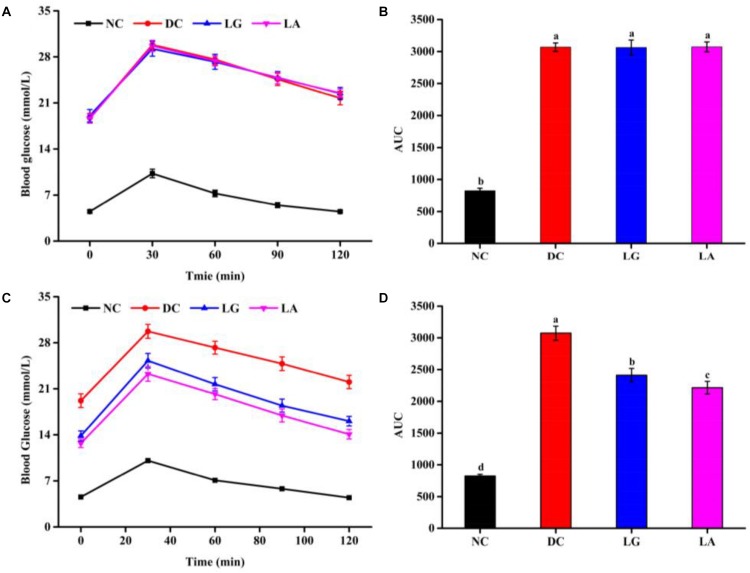
FIGURE 4.
The effect of probiotic treatments on oral glucose tolerance (OGTT) and AUCglucose at weeks 5 and 11. NC, normal control group; DC, diabetic control group; LG, DC plus L. rhamnosus GG; LA, DC plus L. acidophilus KLDS1.0901. (A) OGTT at week 5. (B) AUCglucose at week 5. (C) OGTT at week 11. (D) AUCglucose at week 11. All data are expressed as the mean ± SD (n = 8 independent experiments). Groups without common letters differ significantly from one another (p < 0.05).

