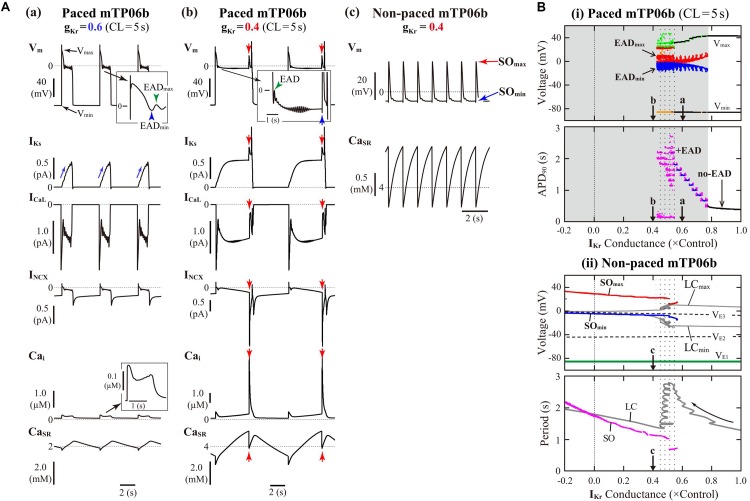
FIGURE 2.
IKr-dependent EAD generation and bifurcations in the mTP06b model. (A) Simulated dynamics of Vm, IKs, ICaL, INCX, Cai, and CaSR (from top to bottom) in the gKr-reduced model cells paced at 0.2 Hz, illustrating two types of EADs. Temporal behaviors of the variables were computed for 30 min; the behaviors elicited by additional 3-4 stimuli are shown. APs with EADs were terminated (Vm repolarized) by gradual increases in IKs (a) or the next stimulus as indicated by the blue arrow (b). Spontaneous SR Ca2+ releases and resulting increases of inward INCX to provoke EADs occurred at gKr = 0.4, as indicated by the red arrows (b). With the smaller gKr, sustained Vm oscillations driven by spontaneous SR Ca2+ releases were observed after cessation of pacing, i.e., in the non-paced model cell (c). (B) Potential extrema of APs and EADs, and the AP duration (APD) measured at 90% repolarization (APD90) are plotted as functions of normalized gKr for the paced model cell (i). One-parameter bifurcation diagrams depicting steady-state Vm at equilibrium points (EPs), the extrema of limit cycles (LCs) and spontaneous oscillations (SOs), and the periods of LCs and SOs plotted against gKr are also shown for the non-paced model cell (ii). In the panel (i), AP dynamics during 0.2-Hz pacing were computed for 1 min at each gKr value, which was reduced from 1.0 to −0.2 at an interval of 0.001. The minimum Vm during AP phase 4 (Vmin) and the maximum Vm during AP phase 2 before EAD formation (Vmax) are indicated by black dots for rhythmic APs, and by orange (Vmin) and light green (Vmax) dots for arrhythmic APs. When EADs appeared, their local potential minimum (EADmin) and maximum (EADmax) were plotted by blue and red dots, respectively. In the panel for APD90, the black, blue, and magenta dots represent APD90 values for regular APs without EAD, regular APs with EADs, and arrhythmic APs with EADs, respectively (no-EAD: APs without EAD, + EAD: APs with EADs). The points labeled as “a” and “b” indicate gKr values for which AP behaviors are shown in Panel (A). In the panel (ii), the steady-state branches as loci of Vm at EPs (VE1–3), periodic branches as the potential minimum (LCmin) and maximum (LCmax) of LCs, and potential extrema of SOs (SOmin, SOmax), as well as the periods of LCs and SOs, are plotted for the non-paced model cell. The steady-state branch VE1 is stable (green solid lines), while VE2 and VE3 unstable (black dashed lines). The periodic branches represented by gray solid lines are always unstable. The point labeled as “c” indicates the gKr values for which SOs are shown in A-c.

