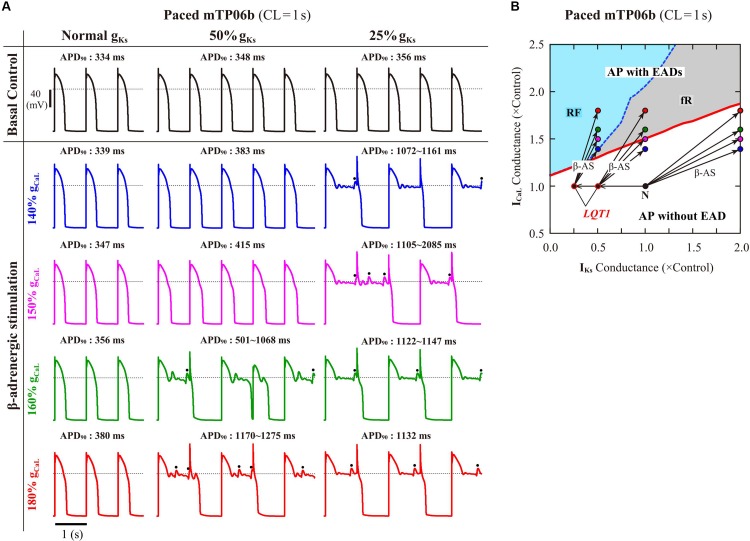
FIGURE 5.
EAD generations during β-AS in the normal and LQT1 versions of the mTP06b model. (A) Simulated APs of the model cells under the basal condition (top) and conditions of β-AS as indicated by the points and arrows in (B). Model cells were paced at 1 Hz for 30 min. The dots denote EADs induced by spontaneous SR Ca2+ releases. (B) A phase diagram on the gKs–gCaL parameter plane depicting displacements of critical points at which EADs emerged during 1-Hz pacing. The critical points were determined during gCaL increases at an interval of 0.002 for individual gKs values increased at intervals of 0.02–0.1. For simulating the conditions of β-AS, the parameters other than gCaL and gKs were modified as stated in the section “Materials and Methods” (see Supplementary Table S2). The LQT1 model cell was assumed to have reduced gKs of 50% or 25% of the control value. The points of the control (basal) conditions for cardiomyocytes with the normal and reduced gKs are labeled as “N” and “LQT1”, respectively. The arrows indicate the parameter shifts from the basal condition to the conditions of β-AS with gKs doubled and gCaL increased to 140, 150, 160 and 180% of the control value.

